Why Set Up A Data Warehouse?

What is a DataWarehouse? And why would you need one?

A data warehouse is a central repository that aggregates data from all transactional and other data sources within a firm, to create a historical archive of all of the firm’s data even when transactional systems have hard data retention constraints.

It provides for the following capabilities:

  • Aggregates data from disparate data sources into a single DB; hence a single query engine can be used to query, join, transform/transpose and present the data.
  • Mitigate the problem of database isolation level lock contention in transactional systems due to running of large analytical queries
  • Maintain data history even when source systems do not and provide a temporal view of the data
  • Ability to create trend reports comparing yoy (year over year) or qoq (quarter over quarter) performance for senior management
  • Improve data quality and drive a consistency in organization information – consistent code/description/ref names/values etc. Allows for flagging and fixing of data
  • Provide a single data model for all data regardless of source
  • Restructure data so that it makes sense to the business users
  • Restructure data to improve query performance
  • Add contextual value to operational systems and enterprise apps like CRMs or ERPs.

What is an Operational Data Store (ODS)?

An ODS is a database designed to integrate data from multiple sources. It allows for cleaning, resolving redundancy and integrity checking before additional operations. The data is then passed back to the operational systems and to the DWH for storage and reporting. It is usually designed to contain atomic or low level data such as transactions and prices and also has limited history which is captured real time or near real time. Much greater volume of data is stored in the DWH generally on a less frequent basis.

Why do we add Data/Strategic Marts to most modern data management platforms?

Data marts are fit for purpose access layers that support specific reporting use for individual teams or use cases for e.g. a sales and operations data mart, or a marketing strategy data mart. Usually a subset of the DWH, and very focused on the elements needed  for the purpose it is designed for. The usual reasons to create data marts are –

  • Easy access to frequently needed data with contentions
  • Creates a collective view for a group of users
  • Improves end user response times
  • Ease of creation and lower cost than a DWH
  • Potential users are well defined than in a full DWH
  • Less cluttered as it contains only business essential data

And finally what are Data Lakes and Swamps?

A single store of all the data in the Enterprise in its raw form. It is a method of storing data within a system or repository in its natural format and facilitates the colocation of data in various schemas, structured and unstructured in files or object blobs or data bases. A deteriorated data lake, inaccessible to its intended users and of no value is called a “data swamp”.

Why On-Boarding Applications Require A Consistent Framework?

My bank has been trying to solve on-boarding for the last 25 years via a variety of on-boarding systems. Given the vagaries of budget cycles, people’s preferences and technology choices, we ended up with over 10-15 systems that did on boarding for specific products, regions and type of clients like Commodities / FX / Derivatives / Options / Swaps / Forwards / Prime Brokerage / OTC Clearing etc. With increased regulations especially FATCA (which I was hired to implement) meant wasteful and fractured capital expenditure in retrofitting each of these 10+ systems to be compliant with regulations. 

To address this, I made the case for going to a single on-boarding platform, where we could maximize feature reuse, optimize investment and be nimble with the capabilities we were rolling out. I refocused the team to move on boarding to this single platform called “The Pipe”. This included negotiating with stakeholders to agree on bare minimum functionality that would let them move to pipe. 

Ensured that all new feature development happened only on the go forward strategic platform. Designed an observer pattern to create FATCA cases (and later every other regulatory case) only on the pipe platform regardless of where the account or client was on-boarded.  This allowed for functionality on the legacy systems to be stymied and for our business to easily move over to the strategic platform. 

We streamlined delivery of functionality into a regular 4-week monthly development cycle followed by a test and deployment cycle. Achieved 99+% of all new client accounts being on-boarded on the pipe platform. Created a common regulatory platform that allows for all reg cases being created on the Pipe platform regardless of where it was created/updated. We were able to streamline development to rollout a new regulatory program in a single release cycle, which otherwise would have taken a project running for a year or more to implement. This helped us rationalize investment and also provided assurance to my business around regulatory compliance; 

Happy to share details around the challenges we faced and the strategies we employed to overcome them.

As always, I welcome any comments or compare notes on a similar situation that you may have come across.

Context Is Important

Knowing your Business Context is key to Product Development.

What is business Context?

Business context is the sum total of conditions that exist in the market – the availability/lack of capital, the demand (customer), supply (competition), your own capabilities (people, process, systems & technology), availability of patents, trade secrets or trade marks, brand access, product lifecycle, supply chain for how your product is assembled, sales, marketing & distribution channels, and other external forces like regulations, government policy.

It allows for you to be able to reconfigure your capabilities to affect business model innovation. A simple context diagram like the following goes a long way towards helping you gain consensus among practitioners, stakeholders and customers.
An organization has its own culture. Understanding power structures and organizational context is critical to being able to innovate. You will need budget, capabilities, resources, and buyin to get anything done. Navigating the corporate labyrinth can only be achieved through selling your ideas.
The following is an example of how we changed the game by introducing a product like Therapeutic Resource Centers into a standard utility business like a PBM.
We have created a proprietary framework to help sell your ideas.  Here is an example of the framework which I have used in the past to validate our strategy.

Setting up a Technology Policy

A Technology Policy describes principles and practices that is used to manage risks within the technology organization in a company. The unconstraint growth of technology systems can introduce inherent risks that can threaten the business model of the firm.

I have had the opportunity to review and author Technology Policies at a number of organizations. The following are the key ingredients in a technology policy. Each of these policies should be accompanied by standards, procedures and controls that make these policies effective.

  • Security
    • Physical & Environmental Security Management: Covers physical access of a firm’s facilities, assets and physical technology from theft, loss, fraud or sabotage.
    • Network Security Management: Covers risk management of a firm’s network from theft, loss, fraud, sabotage or denial of service attacks.
    • Data Security Management: Covers the protection and management of data at rest as well as data in transit between systems internal and external to the firm. Role based access control is a common paradigm that is usually enforced to ensure that private or sensitive data is available only for the right roles and purposes.
    • Technology Risk Management: Covers the choice of technology components that a firm utilizes is in line and supportive of the business objectives and strategy as well as the laws and regulations under which a company operates.
    • Identity and Access Management: Managing access to the firm’s technology assets to prevent unauthorized access, disclosure, modification, theft or loss and fraud.
    • System & Infrastructure Security Management: Covers system/OS, software or other application patches to maintain integrity, performance and continuity of IT operations.
  • Development Practice Management
    • IT Architecture & Governance: Understanding short term and long term implications of technology initiatives/projects/architecture and product selection in alignment with business strategy.
    • System and Application Development and Maintenance Management: Covers application development and maintenance and inventory management of assets.
    • Change Implementation Management: Covers the planning, schedule, implementation and tracking of changes to production environments. Any change needs to be properly planned, scheduled, approved, implemented and verified to avoid disruption of business operations.
  • Data Management
    • Production Strategies: Manage through plans, processes, programs and practices the value and integrity of data produced during a firm’s operations.
    • Consumption Strategies: Manage through plans, processes, programs and practices the value and integrity of data consumed by a firm’s systems and clients and vendors.
  • Operations Risk Management
    • Service Level Management: Covers risk management around performance of firm systems, partner systems, operations and infrastructure performs within the specified service level agreements.
    • Incident & Problem Resolution Management: Management of risk around timely resolution of technology or operational incidents, communication of impact, elimination of root cause of the issues and mitigation of risk of reoccurrence.  Maintain a robust incident and problem management process to improve service delivery and reliability of operations.
    • Capacity Management: Covers risk management around managing availability, reliability, performance and integrity of systems towards maintaining customer, fiduciary and regulatory obligations by anticipating, planning, measuring and managing capacity during regular and peak business operations.
    • Business Continuity & Disaster Recovery Management: Covers management of risks around business continuity in events of disaster whether environmental, physical, political, social or other unanticipated causes. Disaster Recovery process detailing prevention, containment and recovery functions on a timely basis to recover business operations, protect critical infrastructure and assets is a critical part of this policy.
    • Vendor Management: Manage third party vendor operations and support activities in support of regulatory or other supervisory obligations as well as ensuring a good value for money from this technology or operations expenditure.
  • Policy Assurance Management: Manages the specification and adherence to the above policies by the technology, business and operations organizations.

A Primer on Data Management

A number have of folks have asked me about my principles behind managing data. For me, I always apply first principles:

Types of data –

  1. Reference data  – major business entities and their properties; For e.g. and investment bank may consider client, securities and product information to be reference data; A pharmacy may consider Drug, Product, Provider, Patient to be reference data
  2. Master data – this is core business reference data of broad interest to a number of stakeholders; In this case an organization may want to master this data to identify entities that are the same but referenced differently by different systems or stakeholders; Typically you would use an MDM tool to achieve this.
  3. Transaction data – Events, Interactions and transactions. This measures the granular transactions that  different entities do either for trade, or transaction or service. For e.g. an investment bank may have deal transactions, or trade data from sales and trading desk that may be another example. A pharmacy may similarly have Rx fulfillment records as transaction data.
  4. Analytic data – Inference or analysis results derived from transaction data combined with reference data through various means such as correlation or regression etc.
  5. Meta data – data about data such as its, definition, form and purpose
  6. Rules data – Information governing system or human behavior of a process

Types of data storage paradigms –

  1. Flat files – usually used for unstructured data like log files
  2.  DBMS – data base management systems
    1. Hierarchical – a scheme that stores data as a tree of records, with each record having a parent and multiple children for e.g. IBM IMS (Information Management System). Any data access begins from the root record. My first experience with this was while  programming at CSX and British Telecom.
    2. Network – a modification of the hierarchical scheme above to allow for multiple parents and multiple children thus forming a generalized graph structure invented by Charles Bachman. It allows for a better modeling of real life relationships between natural entities. Examples of such implementations are IDS and CA IDMS (Integrated Database Management Systems). Again saw a few implementations at CSX.
    3. Relational or RDBMS – based on the relational model invented by Edgar F Codd at IBM. The general structure of a DB server consists of a storage model (data on disk organized in tables (rows and columns) and indexes, logs and control files), a memory model (similar to storage but consisting only of a portion of most frequently accessed data cached in memory + meta code, plan and SQL statements for accessing that data) and a process model (consisting of a reader, writer, logging and checkpoints). Most modern relational databases like DB2, Oracle, Sybase, My SQL, SQL Server etc. follow a variation of the above. This is by far the most prevalent DBMS model.
    4. Object  or ODBMS is where information is stored in the form of objects as used in OOP. These databases are not table oriented. Examples are Gemstone products (which are now available as Gemfire object cache which is notable for complex event processing, distributed caching, data virtualization and stream event processing) and Realm available as an open source ODBMS.
    5. Object-Relational DBMS which aim to bridge the gap between relational databases and object oriented modeling techniques used in OOP via allowing complex data, type inheritance and object behavior; examples include Illustra and PostgreSQL. Although most modern RDBMS like DB2, Oracle DB, SQL Server now claim  to support ORDBMS via compliance to SQL:1999 via structured types.
    6. NoSQL databases allow storage and retrieval of data modeled outside of tabular relations. Reasons for using them stem from scaling via clusters, simplicity of design and finer control over availability. Many compromise consistency in favor of availability, speed and partition tolerance. A partial list of such databases from wikipedia is as follows –
      1. Column: Accumulo, Cassandra, Druid, HBase, Vertica
      2. Document: Apache CouchDB, ArangoDB, BaseX, Clusterpoint, Couchbase, Cosmos DB, IBM Domino, MarkLogic, MongoDB, OrientDB, Qizx, RethinkDB
      3. Key-value: Aerospike, Apache Ignite, ArangoDB, Couchbase, Dynamo, FairCom c-treeACE, FoundationDB, InfinityDB, MemcacheDB, MUMPS, Oracle NoSQL Database, OrientDB, Redis, Risk, Berkley DB, SDBM/Flat File dbm
      4. Graph: AllegroGraph, ArangoDB, InfiniteGraph, Apache Giraph, MarkLogic, Neo4J, OrientDB, Virtuoso
      5. Multi-model: Apache Ignite, ArangoDB, Couchbase, FoundationDB, InfinityDB, Marklogic, OrientDB

Common Data Processing Paradigms and Questions about why we perform certain operations –

  • Transaction management – OLTP
    • Primarily read access – Is when a system is responsible for reading reference data but not maintaining it. A number of techniques can be utilized for this but primarily the approach is read-only services providing data realtime, readonly stored procs for batch or file access. A number of times people prefer to replicate a read only copy of the master database to reduce contention on the master.
    • Update access – Usually driven off a single master database to maintain consistency with a single set of services or jdbc/odbc drivers providing create/update/delete access, but certain use cases may warrant a multi-master setup.
    • Replication solutions – unidirectional (master-slave), bi-directional, multi-directional (multi-master) or on-premises to cloud replication solutions are available.
  • Analytics – OLAP
    • Star schema – a single large central fact table and one table for each dimension.
    • Snow flake – Is a variant of the star schema model where there still is a single large central fact table and one or more dimension tables, but the dimension tables are normalized in to additional tables.
    • Fact constellation or Galaxy: A collection of star schemas, which is a modification of the above where multiple fact tables share dimension tables.
  • When to create data warehouses vs. data marts vs. data lakes?
    • Data Warehouse – A data warehouse stores data that has been modeled and structured. It holds multiple subject areas with very detailed information and works to integrate all these data sources. It is available for business professionals for running analytics to support their business optimizations. It is fixed configuration, less agile and expensive for large data volumes with a mature security configuration. May not necessarily use a dimension model but feeds other dimension models.
    • Data marts – a mart that contains a single subject area, often with rolled up or summary information with the primary purpose of integrating information from a given subject area or source systems.
    • Data lakes – On the other hand contain structured, semi-structured, unstructured and raw data that is designed for low cost storage whose main consumers are data scientists who want to figure out new and innovative ways to use this data

Defining what your needs are for each of the above dimensions will usually allow you to choose the right product or implementation pattern for getting the most out of your system.

How To Measure Delivery Effectiveness For An IT Team

Common measures that should drive an application or application development team’s metrics collection and measurement:

  • Cadence – how frequent and regular is the release cycle
    • the number of releases per year
    • the probability of keeping a periodic release
  • Delivery throughput – how much content (functionality) is released every release
    • measures such as jira counts weighted by complexity or size
  • Quality – number of defects per cycle
    • defect counts from a defect management system such as ALM or quality center
    • change requests raised post dev commencement
  • Stability – Crashes/ breakage/incidents around the application
    • Crashes
    • Functionality not working
    • Application unavailable
    • Each of the above could be measured via tickets from an incident management system like Service Now
  • Scalability – how easily does the application expand and contract based on usage
    • measure application usage variability across time periods – for e.g. we planned for usage to double for Rx fulfillment at mail order pharmacies during Thanksgiving and Christmas  holidays than normal weeks
    • application scaling around peak usage + a comfortable variance allowance
    • shrinkage back to adjust to non peak usage to effectively manage TCO  and use capacity on demand techniques
  • Usability – how well and easily can your users access or work the application
  • Business Continuity
    • ability to recover in the event of a disaster
    • time to restore service in a continuity scenario

In my opinion, some key pre-requisites that drive good metrics are –

  • Good design and architecture
  • Code reviews and design conformance
  • Scalability isn’t an after thought
  • Usability is designed before the software is written
  • Automated regression and functional testing

I have implemented versions of delivery effectiveness for my teams at both Morgan Stanley and Medco and contrary to most practitioners beliefs, its not that hard to do.  Please reach out if you want a deeper how to discussion.

Org Design: Governance Vs. Delivery

Benefits of keeping governance and delivery functions together

Over the weekend, one of my ex-colleague reached out to me seeking advice on an org design question – should you keep  governance and best practices functions within a delivery organization?

My take: You can either keep governance functions within your best delivery unit or create a separate governance organization but it won’t be successful without assigning it some critical delivery responsibilities.


Here’s an example of what has worked in my professional experience:

At Medco, while running the BPM COE, I was tasked with creating a structure that could parallelize development. We had a massive transformation project, with a scale up target of almost 1000 developers at peak.

We had applications for various products – like mail order dispensing, point of sale adjudications, specialty pharmacy etc. These applications included common workflow capabilities like order processing, customer advocacy, therapeutic resource centers etc. These we chose to implement as frameworks. There were multiple scrum teams working on parallel development. We created a governance group – the Corporate Agile COE that was responsible for orchestrating application delivery across these framework dev groups (COE’s) and the application work station groups (BIACs).  In addition to governance, this group also had some critical enterprise framework delivery responsibilities like authentication and authorization, PHI data access controls, single sign on, personalization framework, and service bus client-server framework.

While governance is a full time job, without delivery responsibilities, it does not carry enough creds to be effective.

Why?

Architecture and Governance should not become an “Ivory Tower”: It needs to be grounded, practical and implementable; Incentives are aligned between delivery and governance, so governance principles are light, not onerous and implementable. And the best way to prove that a design is implementable is to give the person/team proposing it a chance to implement it using the same guidance; The aim for both architecture and governance should be to be simple, rational, elegant and not onerous so as to impact delivery.

Eat your own dog food – hence establish credibility when prescribing your solution: The group prescribing architecture principles is able to demonstrate through their own delivery that it works, hence establishing credibility when prescribing solutions.

Architecture not a scape goat for delivery: Other delivery groups cannot claim that the architecture is unimplementable and thus make the arch and governance group a scapegoat for failed deliveries.


Virtualization – A Necessary Strategy For Any IT Exec

Enabling technologies (inventions) have brought about faster innovation – now that change is constant, we are all trying to outdo the last incremental change. IT Execs have to worry about faster speed to market, which has shrunk from months to now days and even minutes.

Remember the days when a project had to schedule hardware and software change – and if you missed it on your project plan, either you were running on borrowed capacity or running extremely crippled till hardware was ordered, arrived and was provisioned in the data center. Those days are gone; today, capacity on demand is the norm and “one click provisioning” is taken for granted.

This is the case with the large investment bank that I work for where we have our own flavor of cloud and on demand provisioning; even with with smaller enterprises that can use infrastructure cloud providers (AWS/Azure/Digital Ocean/Google etc.) to spin up containers and add capacity on demand.

Very recently while mentoring a nonprofit, I came across a situation where the founder of a dance studio was forced to work on her IT systems more than the organizations mission. Upon probing deeper, we discovered that while IT tools are excellent productivity drivers, a fragmented landscape of solutions is actually a bigger headache to manage than doing this work manually with a pen and paper. This was a problem of fragmented providers and needing a lot of IT savvy to merge and manage data from the owner and founder of the non profit.

We recommended  a virtualized and a consolidated software solution which was accepted enthusiastically. We ended up setting up a word press instance for her in a matter of hours. In fact my 7th grader son pitched in and set up the entire static site for her. Then one of our other volunteers added various plugins like mail chimp and class scheduling and campaign management to the solution.

This is true democratization of tech – it’s not just the monopoly of large orgs with an army of IT folks – anyone can experience this new paradigm and turbo charge their nonprofit/business.

Here’s a graphic that depicts the types of offerings in the market. The boxes in blue represent what is currently available.

IT Industry Evolution

Some History

As humans went from hunter gatherers to agriculture, they settled down in small villages and hamlets. Once agriculture took care of food production, people could focus on specializing their skills – like being a shoe maker or a barber or an iron smith. They then bartered their services for food and products that they themselves did not produce. Next came the advent of money which brought about efficiency in transactions over bartering. After that came the industrial revolution with a large scale focus on mechanization. This was the era where machines powered actions that a human or a group of humans could not do and helped improve the efficiency of a single worker working in a job shop. This human history is very well documented in the Sapiens by Yuval Noah Harari.

The next level of efficiency was achieved by moving from “a job shop” production unit to an assembly line. Henry Ford is credited with introducing this innovation which brought about standardization and higher output. As production moved to assembly lines, there was the need to measure and standardize each action station to improve quality and throughput.

As industry specialized and process engineering became a science, data collection to fine tune processes whether to increase production or to reduce the cash cycle for a firm became important. Hence we saw industries investing in computing technology & resources. Now the trend is to not just eke out efficiencies, but to collect data from the environment or market to influence strategies on how to take advantage of these changes in preferences of consumers and to some extent even shape or mold user preferences.

How has the IT Industry Evolved?

Trends in Computing

Mainframe and Monolithic Architectures:

The first computers were large scale machines with very limited computing power. These mainly were invented as an academic project which later found application in data crunching within industry. Initially only the largest industries could afford it, and run it. I am sure you would remember the punch card drives and the huge cooling towers around the mainframes!

Evolution of Distributed Systems & Client Server architecture:

Since the 80’s we have seen an explosion in the speed at which information can be collected, processed and disseminated. Some advances came from the mainstreaming of IT into every business or organization. Initially the target was automation – simple enterprise systems that were automated for e.g. The production, planning, accounting, sales etc. There were a number of different flavors of distributed platforms that had specific appeals to different sets of users – the windows platform that was very popular in business user computing segment, the mac platform that appealed to an individual user with needs for creative art applications and the unix/linux platforms which appealed to the geeks. Eventually as we saw these platforms compete we saw the linux/java stack start to dominate the back end processing at most business enterprises, while the front end remained windows based and Apple made a big dent into the personal computing segment.

These led to centralized databases which facilitated the collection and analysis of historical data to make processes more efficient. A number of database structures evolved from network to hierarchical, then relational and object databases evolved as a result.

Web Infrastructure and Interconnection of computers

In the 90’s we had the development of the world wide web, with computers forming a connected web, with standardized communication protocols like TCP/IP, HTTP, SMTP etc.  This was a huge improvement to the unconnected islands that businesses and users had maintained prior to this. This really improved the velocity of information travel – from copying data to floppy drives and moving from computer to computer, to directly transmitting information from one computer to another when every node became addressable and ready to understand communication over standard protocols.

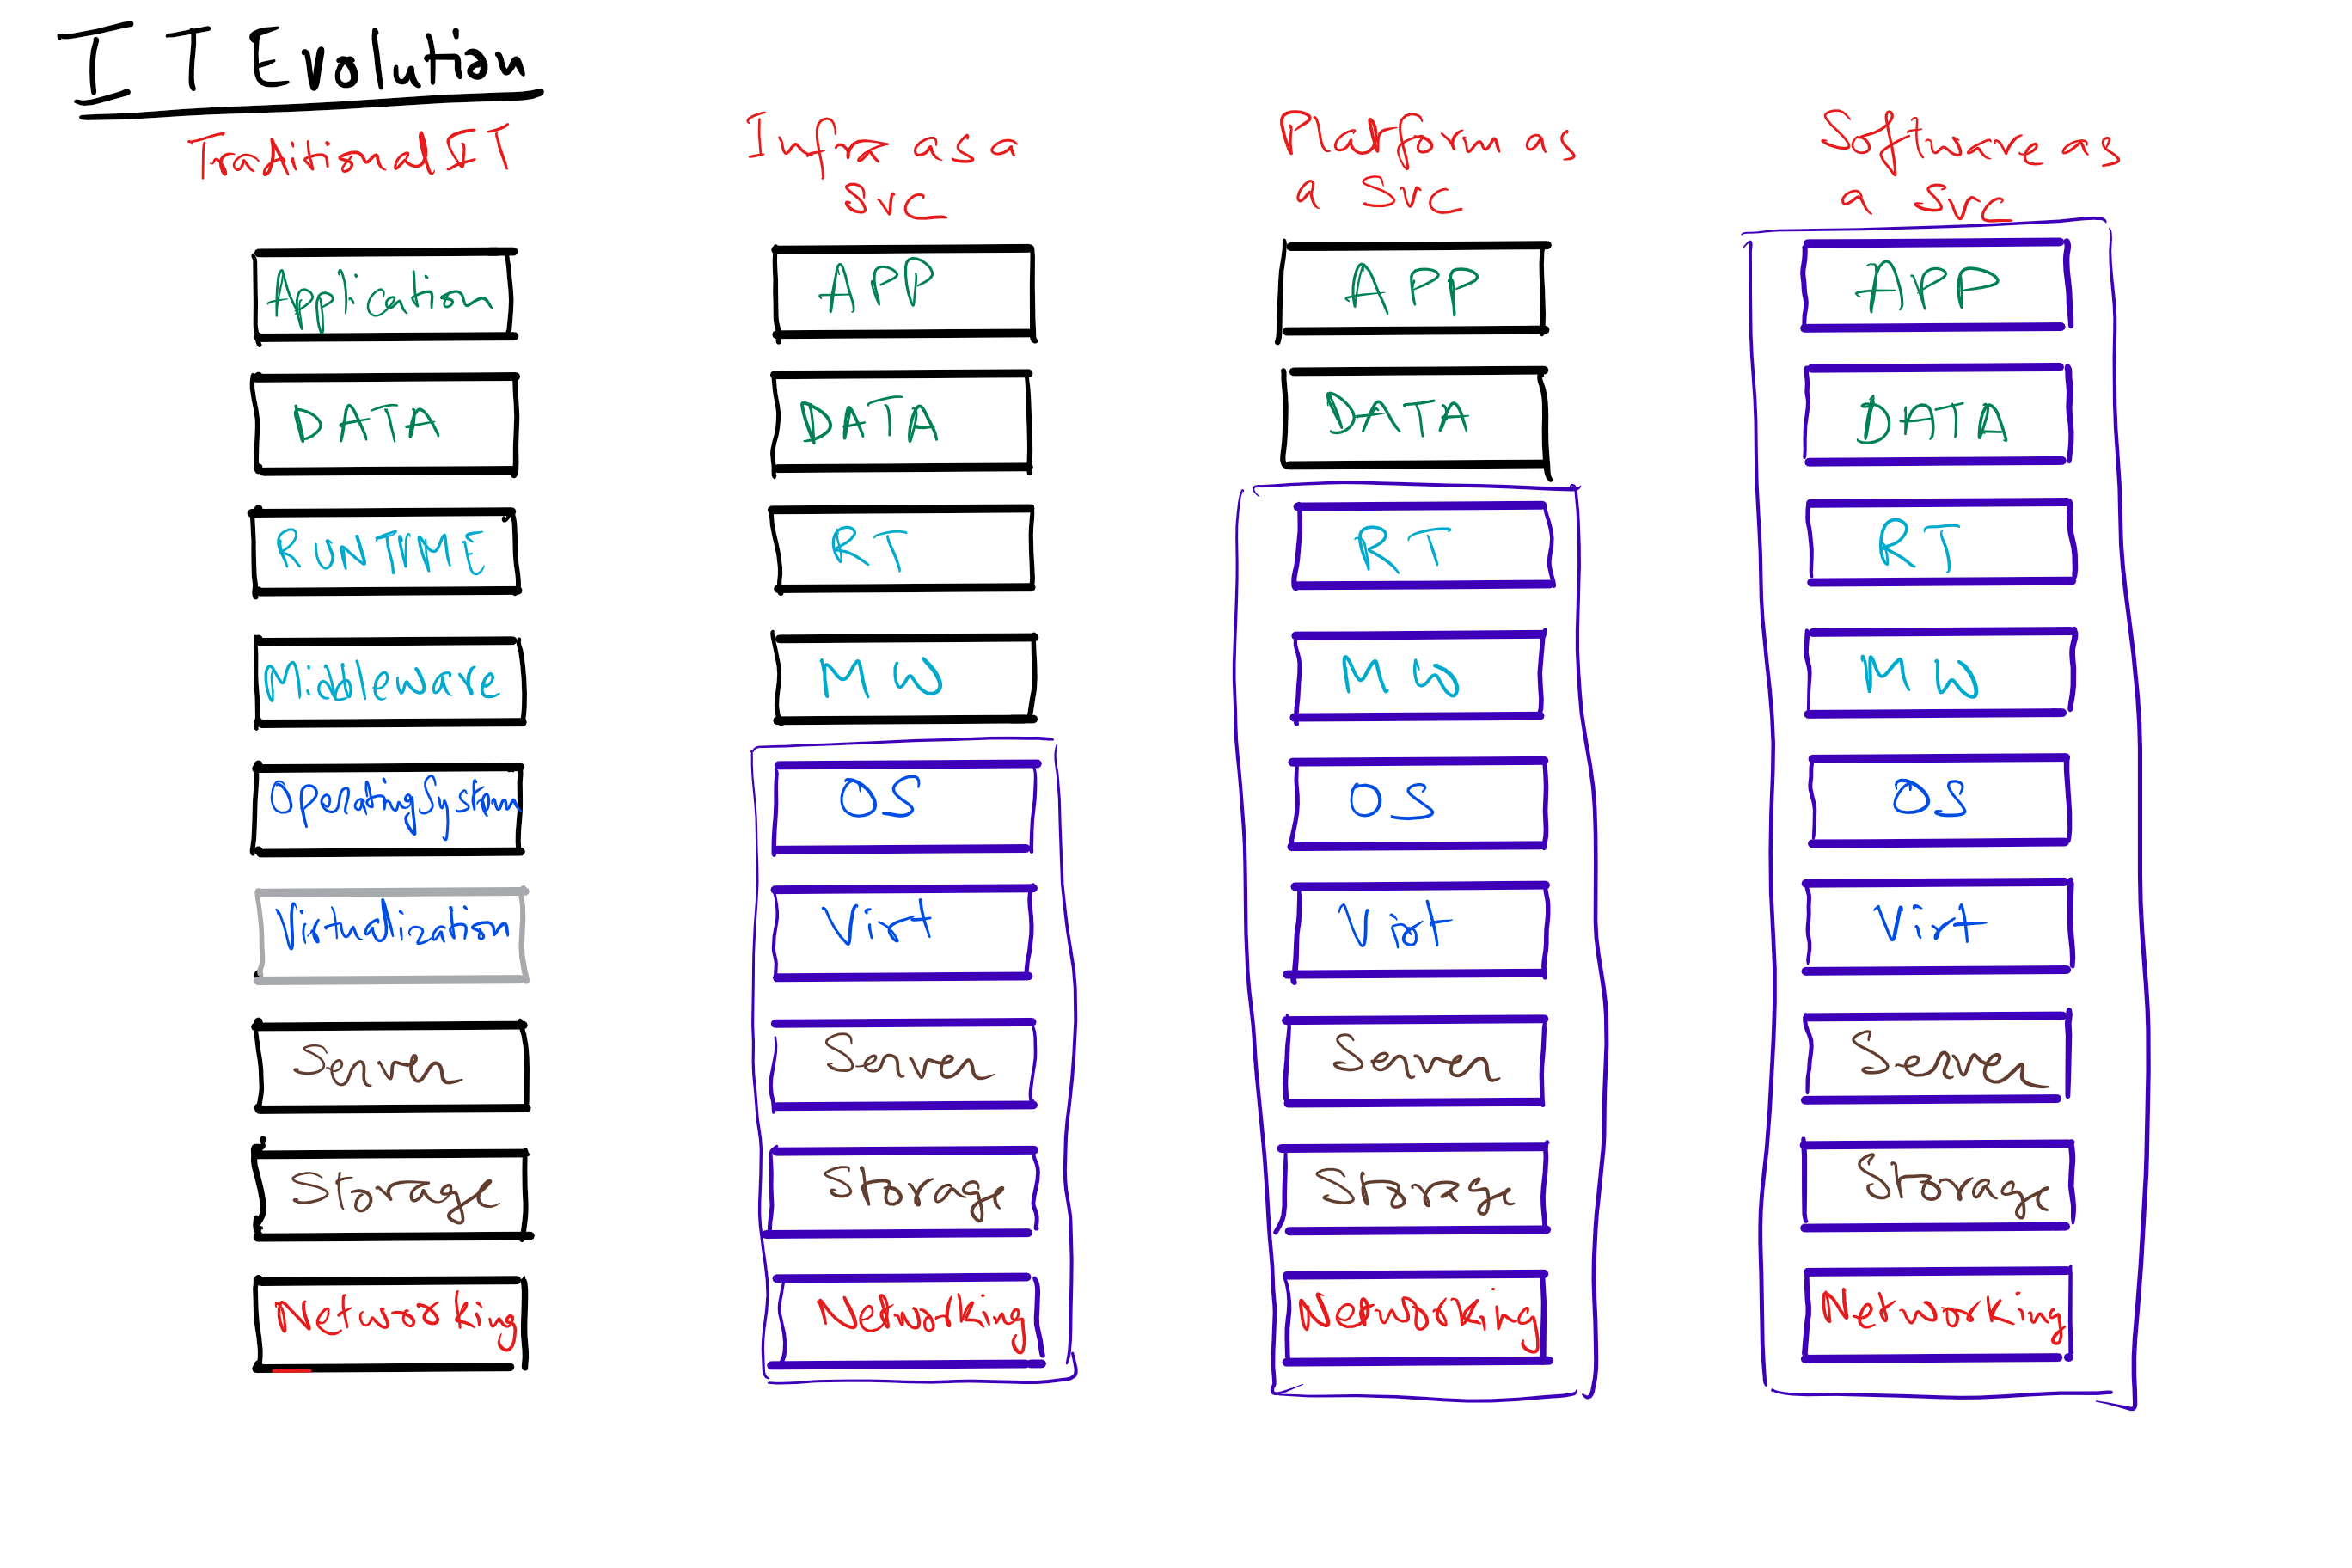
Development of Cloud Infrastructure:

In the 2000’s the trend moved to virtualization and the ability to run multiple processing slices on any physical machine. Computing became fungible and transferable. The idea was if every one was running their own physical servers which were not highly utilized, it would be better to have highly fungible compute and storage slices that could move around virtually to the least busy node, thereby improving efficiency multi folds for our computing and storage hardware.

IoT (Internet of Things)

We have also seen the shrinking of compute hardware to such an extent that this hardware can be embedded in any device or appliance. So a washing machine or a refrigerator may have enough and more computing power as a specialized computer from a few years back, implies each of these devices are capable of producing process data that can be collected and analyzed to measure efficiency or even proactively predict failures or predict trends.

Decentralized Value Exchange:

A parallel development has been the  paradigm shift in creating the ability to transfer value instead of just information. This came about from a seminal paper by Satoshi Nakamoto and the origins of block chain (more on this in another post).

Some call it a fundamental shift in philosophy where we do not need to depend on a central store of value (or authority) to establish the truth. It tackles the double spend problem in a unique and novel way without relying on this central agent. This has spawned applications in various sphere’s like digital currency, money transfer, smart contracts etc. that will definitely change the way we do business.

Big Data Computing

Today the amount of data has become so overwhelming that we find traditional centralized database architectures unable to keep up. This has resulted in a number of new architectures like Hadoop with its own map reduce algorithms and its family of peripheral components/applications like HDFS (Hadoop Distributed File System), Hive (interpreter that turns sql into MR code), PIG (scripting language which gets turned into MR jobs), Impala (sql queries for data in an HDFS cluster), Sqoop (convert data from traditional relational DB into an HDFS cluster), Flume (injesting data generated from source or external systems to put on the HDFS cluster), HBase (realtime DB built on top of HDFS), Hue (graphical front end to the cluster), Oozie (workflow tool), Mahout (machine learning library) etc.

Given this explosion of data that is being produced, collected, processed and acted upon which is beyond human capabilities, we have had to resort to delegating this to machines to collect, process and make sense of these trends – hence the renewed focus on machine learning and artificial intelligence.

Data Analytics and Usage of various Modeling Tools

Given the volume, velocity and variety of data we deal with, its humanly not possible for humans or organizations to analyze this steady stream of data and make sense of it. Hence we have started to construct models to analyze and make sense of this. There are a number of tools available that visualize and provide insights into this data and they inherently use a best fit model that is able to fit to existing data as well as provides predictive value to extrapolations of the causative variables.

This has become so ubiquitous in our lives that everything from credit scores to teacher ratings to how an employee is rated at work all depend on models. One of the critical insights in all this is that our inherent biases get encoded into these models. Hence we need to be careful to not trust these models without establishing their fairness. The best defense that we can employ is transparency and negative feedback control loops that help correct these models for accuracy. Cathy O’Neil has analyzed this very phenomenon in her book Weapons of Math Destruction – a delightful read!

Artificial Intelligence and Machine Learning:

Artificial intelligence is intelligence exhibited by machines. AI attempts to 
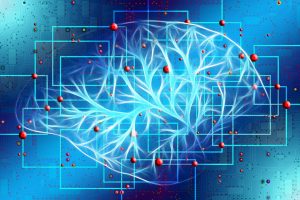
solve the following categories of problems using various methods (statistics, computational intelligence, machine learning or traditional symbolic AI) to achieve goals like social intelligence, creativity and general intelligence.


  • Reasoning
  • Knowledge Representation
  • Planning
  • Learning
  • Natural Language Processing
  • Perception
  • Robotics

There have been a number of efforts into machine autonomous behavior for e.g. autonomous driving cars, that use a variety of sensors like cameras and radars to collect information about the road and other vehicles and make real time decisions about control of the car.


Machine Learning problems can be broadly divided into supervised learning (where we have a body of data that a computer can use to learn and mimic), unsupervised learning (where the computer tries to make sense of patterns in a sea of random data whether through classification or clustering) and reinforcement learning (when a program interacts with a dynamic environment to perform towards a certain goal without an explicit teacher). A general categorization of machine learning tasks are as follows – classification, regression, clustering, density estimation and dimensionality reduction.

Is the ultimate design the creation of a self aware machine that can compete with humans for survival? Will this be a symbiotic relationship or a competition for survival? Are we simply a tool in the evolutionary process playing our part in creating a smarter, better and more resilient new being?