


When you start talking about Machine Learning algorithms, most people’s eyes glaze over – it’s higher order math, something cool and distant that they don’t want to be bothered with.
So how can you engage in a meaningful conversation about these algorithms and demonstrate how and why they add value to make the case for implementing them?
We have had success in showing measurable and quantifiable results from predictions coming from these algorithms that are better than the current state process. Now, everything is not as easy to measure or demonstrate. Hence classifying your ML models into categories and having a measurement framework around each category helps.
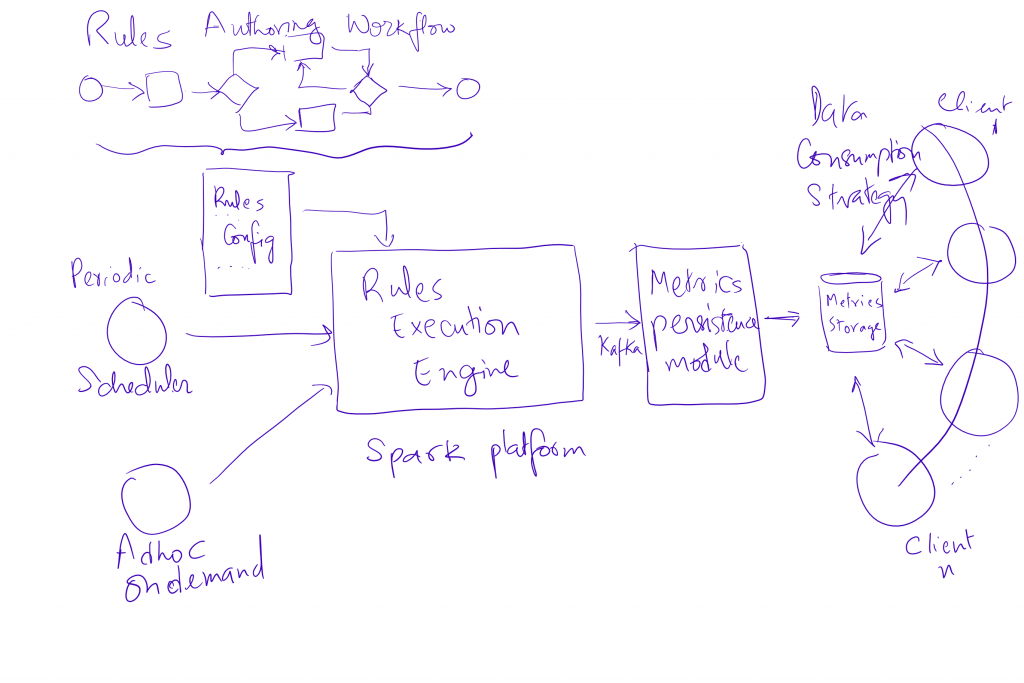
The following elements are critical in establishing such a measurement system:
- A continuously executable platform that can evaluate rule sets and persist results.
- Rule set authoring, configuration, promotion and execution to be configurable and on demand.
- Measurable results that are persisted and can be audited.
- Continuous Improvement: A framework to establish a Champion-Challenger framework, where a production population is using the “champion” set of rules, while a pilot set is using the “challenger”. When we see the challenger doing statistically better than the champion, we have the ability to flip the two.
I have found the following classification useful for the work that my team is doing. Now this isn’t a comprehensive framework of all ML models available, but just something that we have found useful:
- Clustering: The technique of dividing a set of input data into possibly overlapping subsets where the elements of each subset are considered related by some similarity measure. The measures we have used here is commonality by department, division, cost center etc. Typical implementations have used DBSCAN (density based spatial clustering of applications), K-spanning tree, Kernel k-means and shared nearest neighbor clustering algorithms. Typical use cases we have put to clustering are role classification, entitlement clustering etc.
- ARM (Associative Rule Mining): Is a technique to uncover how items are associated to one another. Typically calculate three measures – support (P(A) = occurrences(A)/total ), confidence (confidence(B/A)=P(B,A)/P(A)) and lift (lift(B/A) = support(B,A) / support(B)). We have used it to predict what rights should be offered up to a new employee who joins a group or department.
- Recommender Systems: We have seen success with collaborative filtering (with both item based and user based). UBCF assumes that a user will have a similar rating for an item as its neighbor, if they are similar; while IBCF focusses on what items from all options are more similar to what a user enjoys thus allowing us to directly recalculate the similarity between co-rated items and skip the k-neighborhood search. A key measure we have used in this space to evaluate algorithms is to measure how many times did a user act on a suggestion that was surfaced by a recommender system. We have used this to recommend other items that a user could request with their original request.
- Market Basket Analysis: Technique to uncover association between items by looking at combinations of items that occur together frequently in transactions, to predict the occurrence of an event happening given the occurrence of another.
- Neural Networks: Models which are trained to mimic the behavior of a system. The weights in the model are tuned using the training set till we start getting realistic predictions for new data that the model has not experienced. Some measures here are to keep a record of actual events vs. predicted to measure variance and use continuous feedback to improve predictions. We have plans to use this to learn from system events on the network to infer processes to run in response.
Will keep you posted on the results. Happy to hear about alternate frameworks and paradigms that folks have used to gain acceptance.