Setting Up a Data Science Platform

What is a Data Science Platform?

It’s a platform that allows for data collection, extraction, storage, exploration, visualization, inference & analytics and ultimately modeling to provide predictions and classifications.

Why do you need a data science platform and what do you plan to achieve from it?

Usually the business need is to predict the future and establish causation. In order to predict the future one must determine independent and dependent variables, causation vs. correlation and thus come up with models that allow for predicting what the future will be when we tweak certain causative factors.

What are the key elements needed?

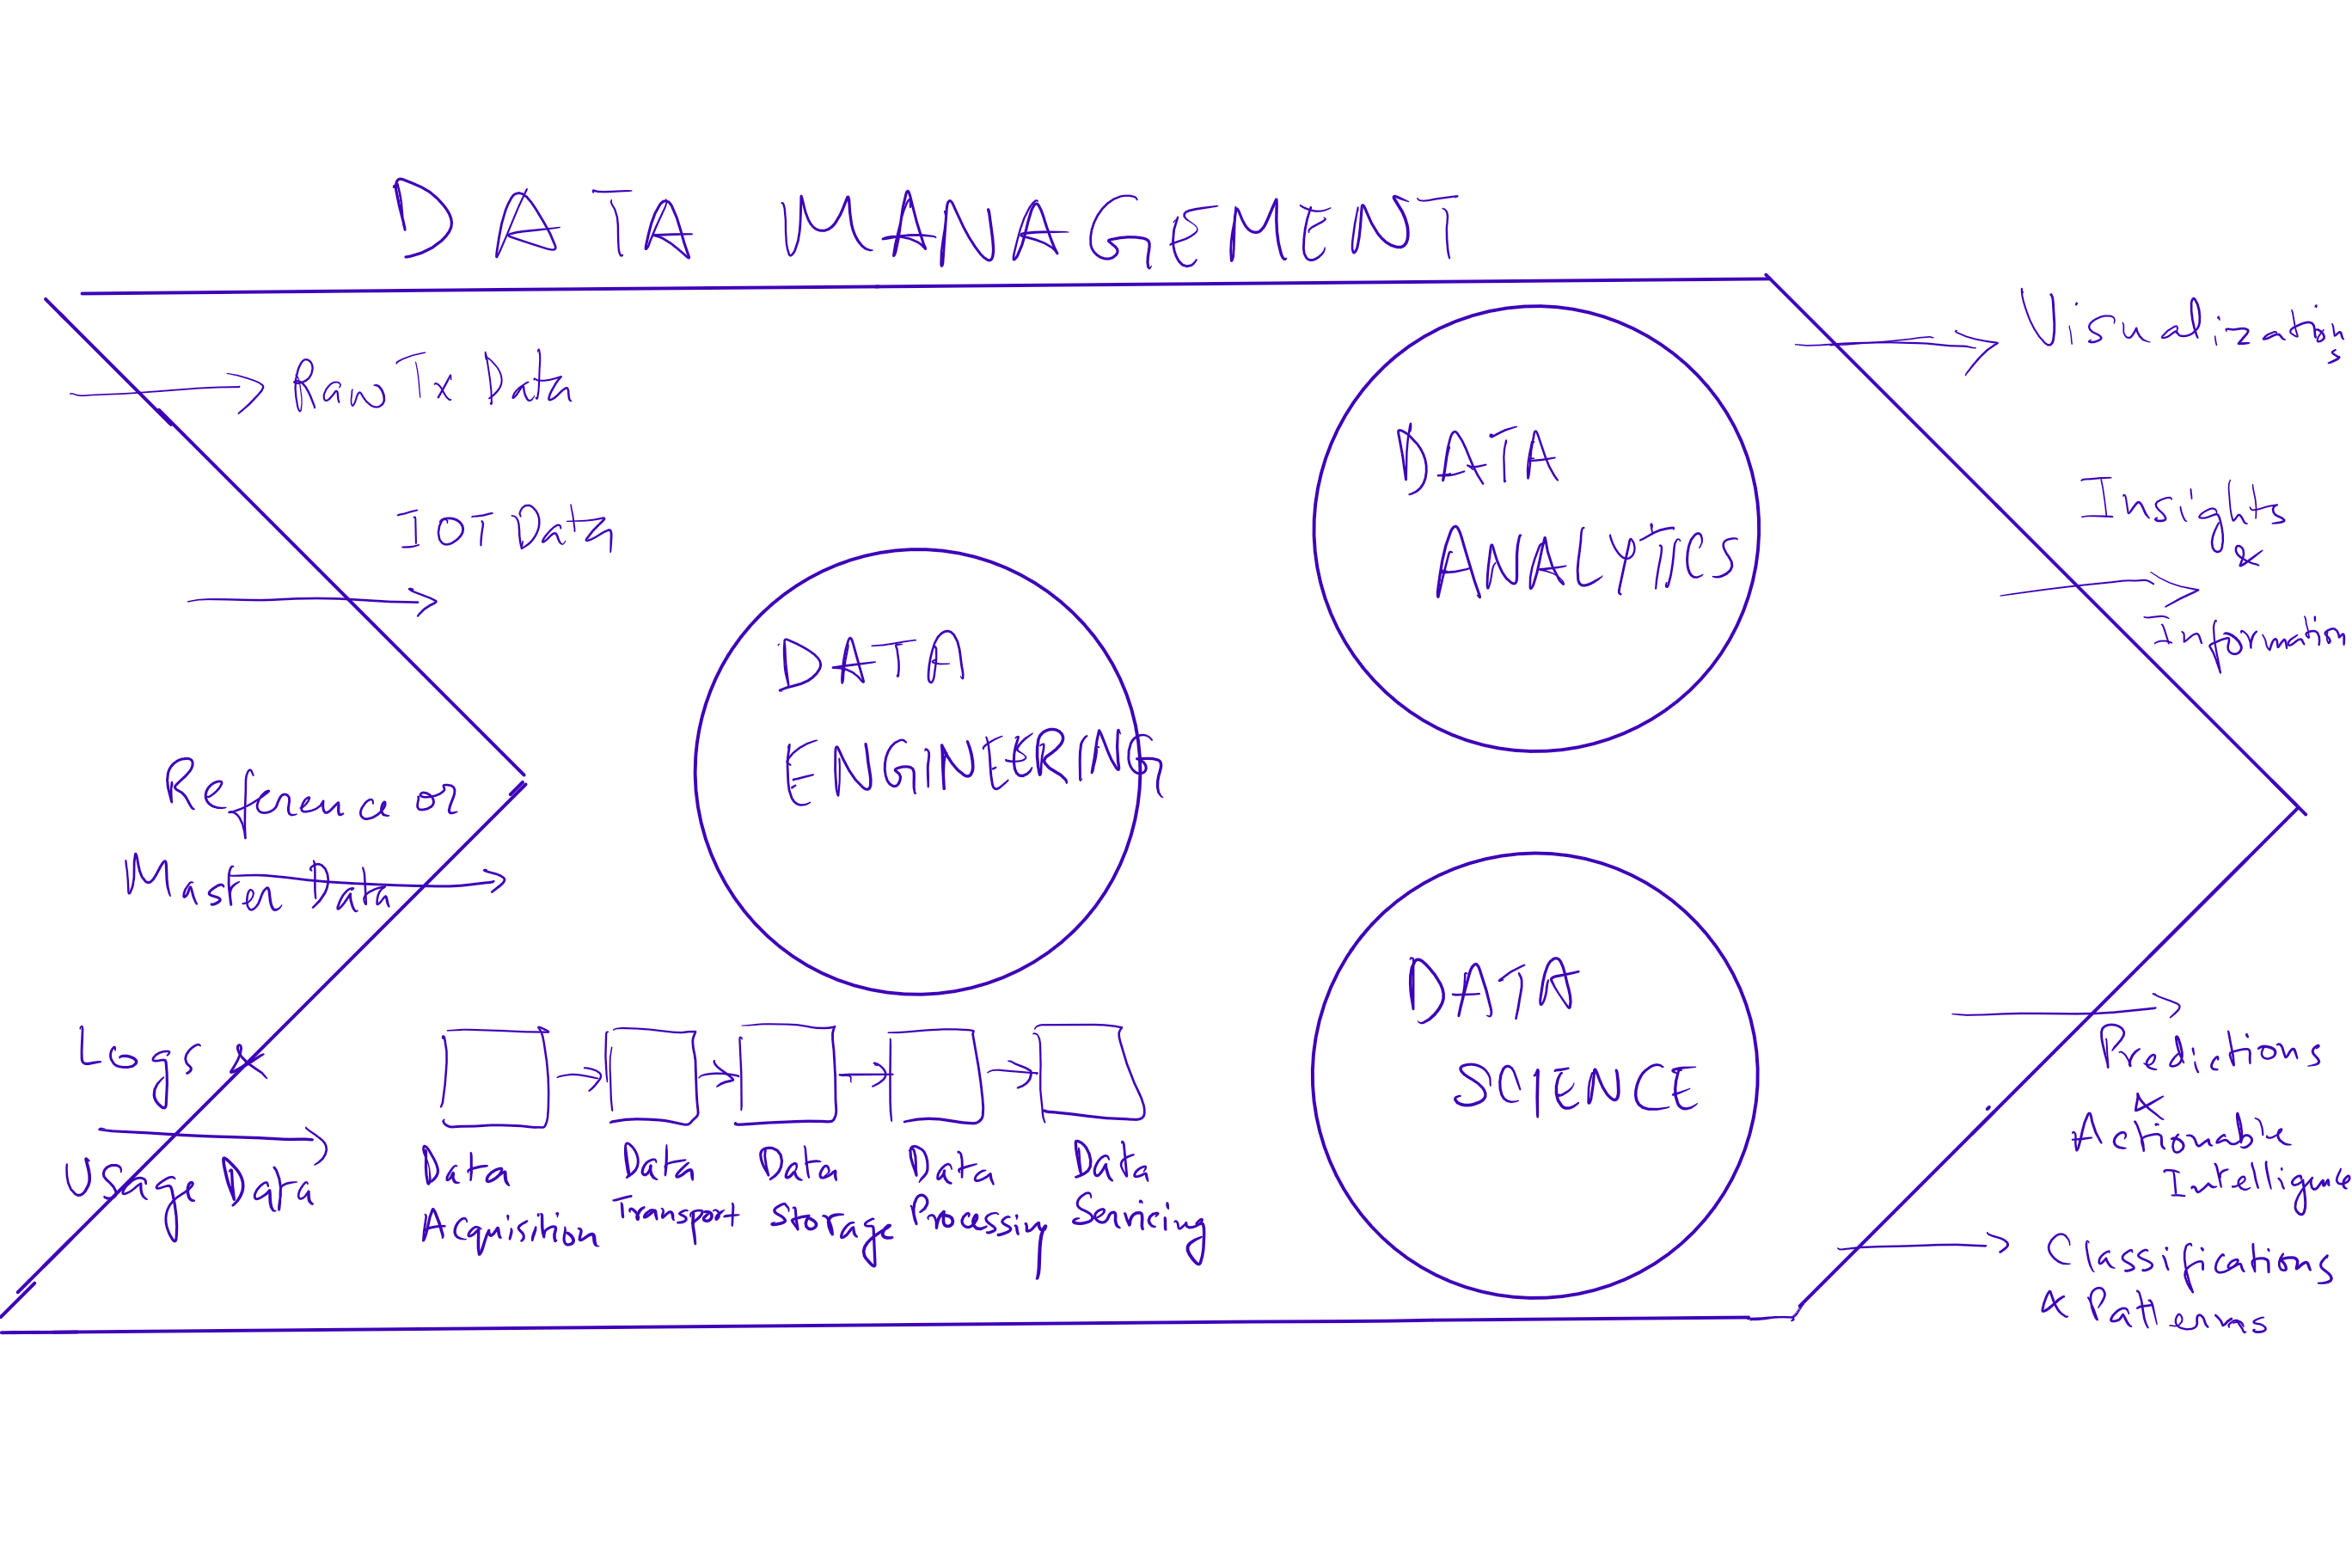
There are mainly three key elements of data management –

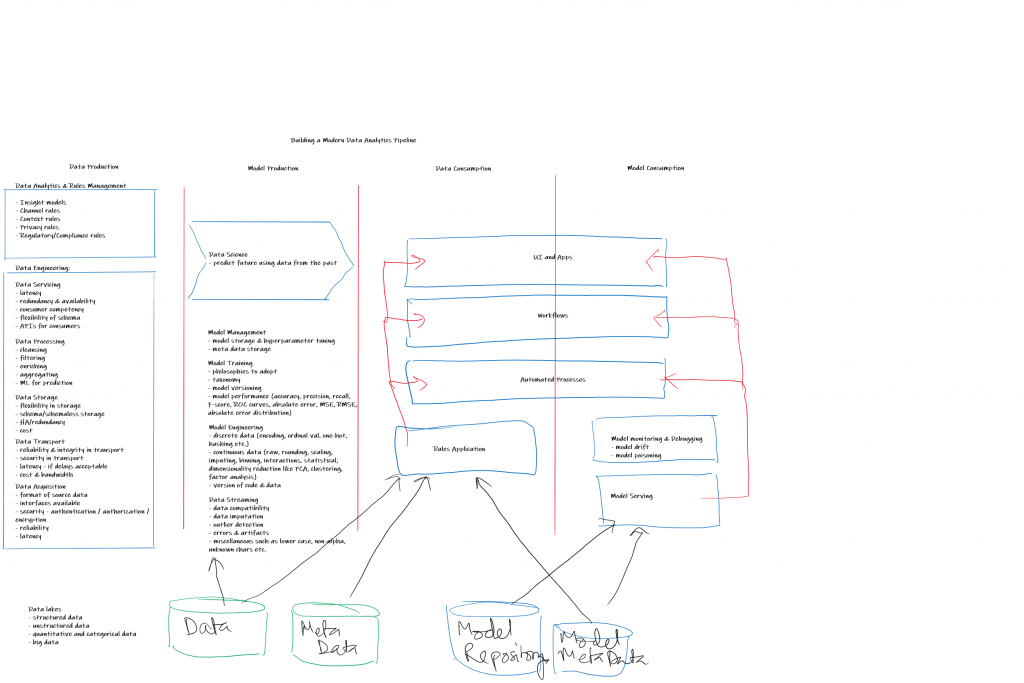
1. Data engineering – is the set of practices that convert raw data to processed data by building data pipelines, applications and APIs. This process is concerned with how data is captured, moved, stored, secured, processed (transformed, cleansed and aggregated) and finally utilized.

The different stages within data engineering are: 

Data acquisition is the process of acquiring data with concerns around the format of source data, existing interfaces that are available or new ones that have to be built, security  (including authentication, authorization and encryption), maintaining reliability and finally latency.

Data transport manages reliability and integrity in transport, security, latency and costs and bandwidth.

Data storage deals with the flexibility in storage, choices around schema and schema less storage, high availability and redundancy and cost of storage.

Data processing deals with transformation, cleansing, filtering, enriching, aggregating and machine learning models for prediction.

Finally, Data Servicing is the availability pattern to end consumers of the data, dealing with latency, redundancy and availability, consumer competency in understanding and utilization of these data sets, flexibility of schema and ultimately the APIs for consumer applications.

2. Data Analytics – Is the practice of using the data produced by data engineering to convert it into insights and information. The tools we currently use in this space are Tableau and Qlikview reporting packages.

3. Data Science – Ability to use analytics and insights to predict the future using data and patterns observed in the past. The work includes integrating and exploring data, building models using such aggregated data, extracting patterns in past data and finally presenting results either through reports or model-powered applications. Some of the key tools we have used on our platform are Jupyter and RStudio for ongoing algorithm development, Spark for distributed execution and Kafka for messaging and data acquisition.

How do big data patterns complicate this exercise?

Big data introduces the following additional complexities in data processing:

1. Volume: the needs for the size of data sets to be managed and processed is usually a few orders of magnitude higher than in usual OLTP scenarios. This means additional resources, ability to scale horizontally and manage latency requirements.

2. Velocity: Needs rem time data and event handling with a view to be fast and avoid bottlenecks.

3. Variety: With data collections augmented by IOT devices in addition to the traditional data collection mechanisms, implies the need to manage text, images, audio and video.

4. Variability:  data may be available in fits and starts implying the need to deal with spikes, an architecture that allows for decoupling and manage using buffers and finally the ability to maintain latency requirements.

Happy to share real life experiences on the above… please reach out if there is interest.

Why Set Up A Data Warehouse?

What is a DataWarehouse? And why would you need one?

A data warehouse is a central repository that aggregates data from all transactional and other data sources within a firm, to create a historical archive of all of the firm’s data even when transactional systems have hard data retention constraints.

It provides for the following capabilities:

  • Aggregates data from disparate data sources into a single DB; hence a single query engine can be used to query, join, transform/transpose and present the data.
  • Mitigate the problem of database isolation level lock contention in transactional systems due to running of large analytical queries
  • Maintain data history even when source systems do not and provide a temporal view of the data
  • Ability to create trend reports comparing yoy (year over year) or qoq (quarter over quarter) performance for senior management
  • Improve data quality and drive a consistency in organization information – consistent code/description/ref names/values etc. Allows for flagging and fixing of data
  • Provide a single data model for all data regardless of source
  • Restructure data so that it makes sense to the business users
  • Restructure data to improve query performance
  • Add contextual value to operational systems and enterprise apps like CRMs or ERPs.

What is an Operational Data Store (ODS)?

An ODS is a database designed to integrate data from multiple sources. It allows for cleaning, resolving redundancy and integrity checking before additional operations. The data is then passed back to the operational systems and to the DWH for storage and reporting. It is usually designed to contain atomic or low level data such as transactions and prices and also has limited history which is captured real time or near real time. Much greater volume of data is stored in the DWH generally on a less frequent basis.

Why do we add Data/Strategic Marts to most modern data management platforms?

Data marts are fit for purpose access layers that support specific reporting use for individual teams or use cases for e.g. a sales and operations data mart, or a marketing strategy data mart. Usually a subset of the DWH, and very focused on the elements needed  for the purpose it is designed for. The usual reasons to create data marts are –

  • Easy access to frequently needed data with contentions
  • Creates a collective view for a group of users
  • Improves end user response times
  • Ease of creation and lower cost than a DWH
  • Potential users are well defined than in a full DWH
  • Less cluttered as it contains only business essential data

And finally what are Data Lakes and Swamps?

A single store of all the data in the Enterprise in its raw form. It is a method of storing data within a system or repository in its natural format and facilitates the colocation of data in various schemas, structured and unstructured in files or object blobs or data bases. A deteriorated data lake, inaccessible to its intended users and of no value is called a “data swamp”.

Why On-Boarding Applications Require A Consistent Framework?

My bank has been trying to solve on-boarding for the last 25 years via a variety of on-boarding systems. Given the vagaries of budget cycles, people’s preferences and technology choices, we ended up with over 10-15 systems that did on boarding for specific products, regions and type of clients like Commodities / FX / Derivatives / Options / Swaps / Forwards / Prime Brokerage / OTC Clearing etc. With increased regulations especially FATCA (which I was hired to implement) meant wasteful and fractured capital expenditure in retrofitting each of these 10+ systems to be compliant with regulations. 

To address this, I made the case for going to a single on-boarding platform, where we could maximize feature reuse, optimize investment and be nimble with the capabilities we were rolling out. I refocused the team to move on boarding to this single platform called “The Pipe”. This included negotiating with stakeholders to agree on bare minimum functionality that would let them move to pipe. 

Ensured that all new feature development happened only on the go forward strategic platform. Designed an observer pattern to create FATCA cases (and later every other regulatory case) only on the pipe platform regardless of where the account or client was on-boarded.  This allowed for functionality on the legacy systems to be stymied and for our business to easily move over to the strategic platform. 

We streamlined delivery of functionality into a regular 4-week monthly development cycle followed by a test and deployment cycle. Achieved 99+% of all new client accounts being on-boarded on the pipe platform. Created a common regulatory platform that allows for all reg cases being created on the Pipe platform regardless of where it was created/updated. We were able to streamline development to rollout a new regulatory program in a single release cycle, which otherwise would have taken a project running for a year or more to implement. This helped us rationalize investment and also provided assurance to my business around regulatory compliance; 

Happy to share details around the challenges we faced and the strategies we employed to overcome them.

As always, I welcome any comments or compare notes on a similar situation that you may have come across.

How To Determine Which Machine Learning Technique Is Right For You?

Machine Learning is a vast field with various techniques available to a practitioner. This blog is about how to navigate this space and apply the right methods for your problem.

What is Machine Learning?

Tom Mitchel provides a very apt definition: “A computer program is said to learn from experience E with respect to some class of tasks T and performance measure P, if its performance at tasks in T, as measured by P, improves with experience E.”

E = the experience of playing many games.

T = the task of playing an individual game.

P = the probability that the program will win the next game.

For example a machine playing Go was able to beat the world’s best Go player. Earlier machines were dependent on humans to provide the example learning set. But in this instant, the machine was able to play against itself, and learn the basic Go techniques.

Broad classification of Machine Learning techniques are:

Supervised Learning: A set of problems where there is a relationship between input and output; Given a data set where we already know the correct output,  we can train a machine to derive this relationship and use this model to predict outcomes for previously unknown data points. These are broadly classified under “regression” and “classification” problems.

  • Regression: When we try to predict results within a continuous output meaning we try to map input variables to some continuous function.  For e.g. given the picture of a person, predicting the age of the person.
    1. Gradient Descent – or steepest descent is an optimization technique to follow the largest derivative to get to a local or global minima. This technique is often used in machine learning applications to calculate the coefficients in regression curve fitting over a training data set. Using these curve fitting coefficients, the program can then make  predictions on a continuous valued output for any new datasets presented to it.
    2. Normal Equation –  (\[\theta=(X^TX)^{-1}X^Ty\]) Refers to a set of simultaneous equations involving experimental unknowns and derived from a large number of observation equations using least squares adjustments.
    3. Neural Networks: Refers to a system of connected nodes that mimic our brains (biological neural networks). Such systems learn the model coefficients by observing real life data and once tuned can be used in output predictions for unseen data or observations outside the training set.  
  • Classification: When we try to predict results in a discrete output i.e. map input variables into discrete categories.  For e.g. given a patient with tumor, predicting whether its benign or malignant. Types of classification algorithms: 
    1. Large Margin Classification
    2. Kernels
    3. Support Vector Machines


Unsupervised Learning: When we derive the structure by clustering the data based on relationships among the variables in the data. With unsupervised learning there is no feedback based on the prediction results.


  • Clustering: Its the process of dividing a set of input data into possibly overlapping, subsets, where elements of each subset are considered related by some similarity measure. Take a collection of data, and find a way to automatically group this data that are similar or related by different variables. For e.g. the clustering of news on the google news home page.

Some classic graph clustering algorithms are the following:

  1. Kernel K-means : Select k data points from i/p as centroids, assign data points to nearest centroid; recompute centroid for each cluster till centroids do not change.
  2. K-spanning tree: Obtain the minimum spacing tree (MST) of an input graph; removing k-1 edges from the MST results in k clusters.
  3. Shared nearest neighbor: Obtain the shared nearest neighbor (SNN) graph the input graph; removing edges from the SNN with weight less than τ results in groups of non overlapping vertices. 
  4. Betweenness centrality based: quantifies the degree to which a vertex (or edge) occurs on the shortest path between all other pairs of nodes.  
  5. Highly connected components: the minimum set of edges whose removal disconnects a graph to produce a highly connected subgraph (HCS). 
  6.  Maximal clique enumeration : A subgraph C of graph G with edges between all pairs of nodes; Maximal clique is a clique not part of the larger clique; 


  • Non-Clustering: Allows you to find structure in a chaotic environment.
    1. Reinforced Learning: where software agents automatically determine ideal behavior to maximize performance.
    2. Recommender Systems: Is an information filtering system that seeks to predict the preference for an item from a user’s perspective by watching and learning the user’s behavior.
    3. Natural Language Processing: Is a field that deals with machine interaction with human languages. Specifically manages the following 3 challenges: speech recognition, understanding and response generation.


And finally, remember the 7 essential steps in accomplishing your machine learning project are the following:

  • Gathering the data
  • Preparing the data
  • Choosing a Model
  • Training your Model
  • Evaluating your Model parameters
  • Hyperparameter training
  • And finally prediction


Setting up a Technology Policy

A Technology Policy describes principles and practices that is used to manage risks within the technology organization in a company. The unconstraint growth of technology systems can introduce inherent risks that can threaten the business model of the firm.

I have had the opportunity to review and author Technology Policies at a number of organizations. The following are the key ingredients in a technology policy. Each of these policies should be accompanied by standards, procedures and controls that make these policies effective.

  • Security
    • Physical & Environmental Security Management: Covers physical access of a firm’s facilities, assets and physical technology from theft, loss, fraud or sabotage.
    • Network Security Management: Covers risk management of a firm’s network from theft, loss, fraud, sabotage or denial of service attacks.
    • Data Security Management: Covers the protection and management of data at rest as well as data in transit between systems internal and external to the firm. Role based access control is a common paradigm that is usually enforced to ensure that private or sensitive data is available only for the right roles and purposes.
    • Technology Risk Management: Covers the choice of technology components that a firm utilizes is in line and supportive of the business objectives and strategy as well as the laws and regulations under which a company operates.
    • Identity and Access Management: Managing access to the firm’s technology assets to prevent unauthorized access, disclosure, modification, theft or loss and fraud.
    • System & Infrastructure Security Management: Covers system/OS, software or other application patches to maintain integrity, performance and continuity of IT operations.
  • Development Practice Management
    • IT Architecture & Governance: Understanding short term and long term implications of technology initiatives/projects/architecture and product selection in alignment with business strategy.
    • System and Application Development and Maintenance Management: Covers application development and maintenance and inventory management of assets.
    • Change Implementation Management: Covers the planning, schedule, implementation and tracking of changes to production environments. Any change needs to be properly planned, scheduled, approved, implemented and verified to avoid disruption of business operations.
  • Data Management
    • Production Strategies: Manage through plans, processes, programs and practices the value and integrity of data produced during a firm’s operations.
    • Consumption Strategies: Manage through plans, processes, programs and practices the value and integrity of data consumed by a firm’s systems and clients and vendors.
  • Operations Risk Management
    • Service Level Management: Covers risk management around performance of firm systems, partner systems, operations and infrastructure performs within the specified service level agreements.
    • Incident & Problem Resolution Management: Management of risk around timely resolution of technology or operational incidents, communication of impact, elimination of root cause of the issues and mitigation of risk of reoccurrence.  Maintain a robust incident and problem management process to improve service delivery and reliability of operations.
    • Capacity Management: Covers risk management around managing availability, reliability, performance and integrity of systems towards maintaining customer, fiduciary and regulatory obligations by anticipating, planning, measuring and managing capacity during regular and peak business operations.
    • Business Continuity & Disaster Recovery Management: Covers management of risks around business continuity in events of disaster whether environmental, physical, political, social or other unanticipated causes. Disaster Recovery process detailing prevention, containment and recovery functions on a timely basis to recover business operations, protect critical infrastructure and assets is a critical part of this policy.
    • Vendor Management: Manage third party vendor operations and support activities in support of regulatory or other supervisory obligations as well as ensuring a good value for money from this technology or operations expenditure.
  • Policy Assurance Management: Manages the specification and adherence to the above policies by the technology, business and operations organizations.

A Primer on Data Management

A number have of folks have asked me about my principles behind managing data. For me, I always apply first principles:

Types of data –

  1. Reference data  – major business entities and their properties; For e.g. and investment bank may consider client, securities and product information to be reference data; A pharmacy may consider Drug, Product, Provider, Patient to be reference data
  2. Master data – this is core business reference data of broad interest to a number of stakeholders; In this case an organization may want to master this data to identify entities that are the same but referenced differently by different systems or stakeholders; Typically you would use an MDM tool to achieve this.
  3. Transaction data – Events, Interactions and transactions. This measures the granular transactions that  different entities do either for trade, or transaction or service. For e.g. an investment bank may have deal transactions, or trade data from sales and trading desk that may be another example. A pharmacy may similarly have Rx fulfillment records as transaction data.
  4. Analytic data – Inference or analysis results derived from transaction data combined with reference data through various means such as correlation or regression etc.
  5. Meta data – data about data such as its, definition, form and purpose
  6. Rules data – Information governing system or human behavior of a process

Types of data storage paradigms –

  1. Flat files – usually used for unstructured data like log files
  2.  DBMS – data base management systems
    1. Hierarchical – a scheme that stores data as a tree of records, with each record having a parent and multiple children for e.g. IBM IMS (Information Management System). Any data access begins from the root record. My first experience with this was while  programming at CSX and British Telecom.
    2. Network – a modification of the hierarchical scheme above to allow for multiple parents and multiple children thus forming a generalized graph structure invented by Charles Bachman. It allows for a better modeling of real life relationships between natural entities. Examples of such implementations are IDS and CA IDMS (Integrated Database Management Systems). Again saw a few implementations at CSX.
    3. Relational or RDBMS – based on the relational model invented by Edgar F Codd at IBM. The general structure of a DB server consists of a storage model (data on disk organized in tables (rows and columns) and indexes, logs and control files), a memory model (similar to storage but consisting only of a portion of most frequently accessed data cached in memory + meta code, plan and SQL statements for accessing that data) and a process model (consisting of a reader, writer, logging and checkpoints). Most modern relational databases like DB2, Oracle, Sybase, My SQL, SQL Server etc. follow a variation of the above. This is by far the most prevalent DBMS model.
    4. Object  or ODBMS is where information is stored in the form of objects as used in OOP. These databases are not table oriented. Examples are Gemstone products (which are now available as Gemfire object cache which is notable for complex event processing, distributed caching, data virtualization and stream event processing) and Realm available as an open source ODBMS.
    5. Object-Relational DBMS which aim to bridge the gap between relational databases and object oriented modeling techniques used in OOP via allowing complex data, type inheritance and object behavior; examples include Illustra and PostgreSQL. Although most modern RDBMS like DB2, Oracle DB, SQL Server now claim  to support ORDBMS via compliance to SQL:1999 via structured types.
    6. NoSQL databases allow storage and retrieval of data modeled outside of tabular relations. Reasons for using them stem from scaling via clusters, simplicity of design and finer control over availability. Many compromise consistency in favor of availability, speed and partition tolerance. A partial list of such databases from wikipedia is as follows –
      1. Column: Accumulo, Cassandra, Druid, HBase, Vertica
      2. Document: Apache CouchDB, ArangoDB, BaseX, Clusterpoint, Couchbase, Cosmos DB, IBM Domino, MarkLogic, MongoDB, OrientDB, Qizx, RethinkDB
      3. Key-value: Aerospike, Apache Ignite, ArangoDB, Couchbase, Dynamo, FairCom c-treeACE, FoundationDB, InfinityDB, MemcacheDB, MUMPS, Oracle NoSQL Database, OrientDB, Redis, Risk, Berkley DB, SDBM/Flat File dbm
      4. Graph: AllegroGraph, ArangoDB, InfiniteGraph, Apache Giraph, MarkLogic, Neo4J, OrientDB, Virtuoso
      5. Multi-model: Apache Ignite, ArangoDB, Couchbase, FoundationDB, InfinityDB, Marklogic, OrientDB

Common Data Processing Paradigms and Questions about why we perform certain operations –

  • Transaction management – OLTP
    • Primarily read access – Is when a system is responsible for reading reference data but not maintaining it. A number of techniques can be utilized for this but primarily the approach is read-only services providing data realtime, readonly stored procs for batch or file access. A number of times people prefer to replicate a read only copy of the master database to reduce contention on the master.
    • Update access – Usually driven off a single master database to maintain consistency with a single set of services or jdbc/odbc drivers providing create/update/delete access, but certain use cases may warrant a multi-master setup.
    • Replication solutions – unidirectional (master-slave), bi-directional, multi-directional (multi-master) or on-premises to cloud replication solutions are available.
  • Analytics – OLAP
    • Star schema – a single large central fact table and one table for each dimension.
    • Snow flake – Is a variant of the star schema model where there still is a single large central fact table and one or more dimension tables, but the dimension tables are normalized in to additional tables.
    • Fact constellation or Galaxy: A collection of star schemas, which is a modification of the above where multiple fact tables share dimension tables.
  • When to create data warehouses vs. data marts vs. data lakes?
    • Data Warehouse – A data warehouse stores data that has been modeled and structured. It holds multiple subject areas with very detailed information and works to integrate all these data sources. It is available for business professionals for running analytics to support their business optimizations. It is fixed configuration, less agile and expensive for large data volumes with a mature security configuration. May not necessarily use a dimension model but feeds other dimension models.
    • Data marts – a mart that contains a single subject area, often with rolled up or summary information with the primary purpose of integrating information from a given subject area or source systems.
    • Data lakes – On the other hand contain structured, semi-structured, unstructured and raw data that is designed for low cost storage whose main consumers are data scientists who want to figure out new and innovative ways to use this data

Defining what your needs are for each of the above dimensions will usually allow you to choose the right product or implementation pattern for getting the most out of your system.

How To Measure Delivery Effectiveness For An IT Team

Common measures that should drive an application or application development team’s metrics collection and measurement:

  • Cadence – how frequent and regular is the release cycle
    • the number of releases per year
    • the probability of keeping a periodic release
  • Delivery throughput – how much content (functionality) is released every release
    • measures such as jira counts weighted by complexity or size
  • Quality – number of defects per cycle
    • defect counts from a defect management system such as ALM or quality center
    • change requests raised post dev commencement
  • Stability – Crashes/ breakage/incidents around the application
    • Crashes
    • Functionality not working
    • Application unavailable
    • Each of the above could be measured via tickets from an incident management system like Service Now
  • Scalability – how easily does the application expand and contract based on usage
    • measure application usage variability across time periods – for e.g. we planned for usage to double for Rx fulfillment at mail order pharmacies during Thanksgiving and Christmas  holidays than normal weeks
    • application scaling around peak usage + a comfortable variance allowance
    • shrinkage back to adjust to non peak usage to effectively manage TCO  and use capacity on demand techniques
  • Usability – how well and easily can your users access or work the application
  • Business Continuity
    • ability to recover in the event of a disaster
    • time to restore service in a continuity scenario

In my opinion, some key pre-requisites that drive good metrics are –

  • Good design and architecture
  • Code reviews and design conformance
  • Scalability isn’t an after thought
  • Usability is designed before the software is written
  • Automated regression and functional testing

I have implemented versions of delivery effectiveness for my teams at both Morgan Stanley and Medco and contrary to most practitioners beliefs, its not that hard to do.  Please reach out if you want a deeper how to discussion.

Org Design: Governance Vs. Delivery

Benefits of keeping governance and delivery functions together

Over the weekend, one of my ex-colleague reached out to me seeking advice on an org design question – should you keep  governance and best practices functions within a delivery organization?

My take: You can either keep governance functions within your best delivery unit or create a separate governance organization but it won’t be successful without assigning it some critical delivery responsibilities.


Here’s an example of what has worked in my professional experience:

At Medco, while running the BPM COE, I was tasked with creating a structure that could parallelize development. We had a massive transformation project, with a scale up target of almost 1000 developers at peak.

We had applications for various products – like mail order dispensing, point of sale adjudications, specialty pharmacy etc. These applications included common workflow capabilities like order processing, customer advocacy, therapeutic resource centers etc. These we chose to implement as frameworks. There were multiple scrum teams working on parallel development. We created a governance group – the Corporate Agile COE that was responsible for orchestrating application delivery across these framework dev groups (COE’s) and the application work station groups (BIACs).  In addition to governance, this group also had some critical enterprise framework delivery responsibilities like authentication and authorization, PHI data access controls, single sign on, personalization framework, and service bus client-server framework.

While governance is a full time job, without delivery responsibilities, it does not carry enough creds to be effective.

Why?

Architecture and Governance should not become an “Ivory Tower”: It needs to be grounded, practical and implementable; Incentives are aligned between delivery and governance, so governance principles are light, not onerous and implementable. And the best way to prove that a design is implementable is to give the person/team proposing it a chance to implement it using the same guidance; The aim for both architecture and governance should be to be simple, rational, elegant and not onerous so as to impact delivery.

Eat your own dog food – hence establish credibility when prescribing your solution: The group prescribing architecture principles is able to demonstrate through their own delivery that it works, hence establishing credibility when prescribing solutions.

Architecture not a scape goat for delivery: Other delivery groups cannot claim that the architecture is unimplementable and thus make the arch and governance group a scapegoat for failed deliveries.


Virtualization – A Necessary Strategy For Any IT Exec

Enabling technologies (inventions) have brought about faster innovation – now that change is constant, we are all trying to outdo the last incremental change. IT Execs have to worry about faster speed to market, which has shrunk from months to now days and even minutes.

Remember the days when a project had to schedule hardware and software change – and if you missed it on your project plan, either you were running on borrowed capacity or running extremely crippled till hardware was ordered, arrived and was provisioned in the data center. Those days are gone; today, capacity on demand is the norm and “one click provisioning” is taken for granted.

This is the case with the large investment bank that I work for where we have our own flavor of cloud and on demand provisioning; even with with smaller enterprises that can use infrastructure cloud providers (AWS/Azure/Digital Ocean/Google etc.) to spin up containers and add capacity on demand.

Very recently while mentoring a nonprofit, I came across a situation where the founder of a dance studio was forced to work on her IT systems more than the organizations mission. Upon probing deeper, we discovered that while IT tools are excellent productivity drivers, a fragmented landscape of solutions is actually a bigger headache to manage than doing this work manually with a pen and paper. This was a problem of fragmented providers and needing a lot of IT savvy to merge and manage data from the owner and founder of the non profit.

We recommended  a virtualized and a consolidated software solution which was accepted enthusiastically. We ended up setting up a word press instance for her in a matter of hours. In fact my 7th grader son pitched in and set up the entire static site for her. Then one of our other volunteers added various plugins like mail chimp and class scheduling and campaign management to the solution.

This is true democratization of tech – it’s not just the monopoly of large orgs with an army of IT folks – anyone can experience this new paradigm and turbo charge their nonprofit/business.

Here’s a graphic that depicts the types of offerings in the market. The boxes in blue represent what is currently available.