Therapeutic Resource Centers

We introduced a product called Therapeutic Resource Center at Medco in 2007/8. It was an extremely innovative product that was soon copied by most of our competitors. 

Here’s a brief history of how we developed this product. 

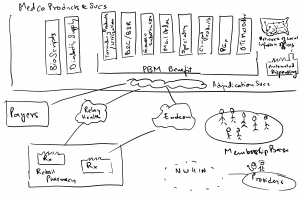
Medco consisted of two main businesses – the PBM business which basically was adjudication of a patient’s drug benefit – which drugs would be covered, what would be on the formulary, copay a patient had to cover out of pocket when filling a prescription, how much would a pharmacy be paid, what would we bill a payer for this transaction; the second was the mail order pharmacy dispensing business. Here we asked patients on maintenance medications, to fill their prescription at mail order. A patient would request their doctor to send their prescription to our MO pharmacy. We would then fill a 90 day prescription for the same copay as a retail pharmacy for a 30 day prescription.

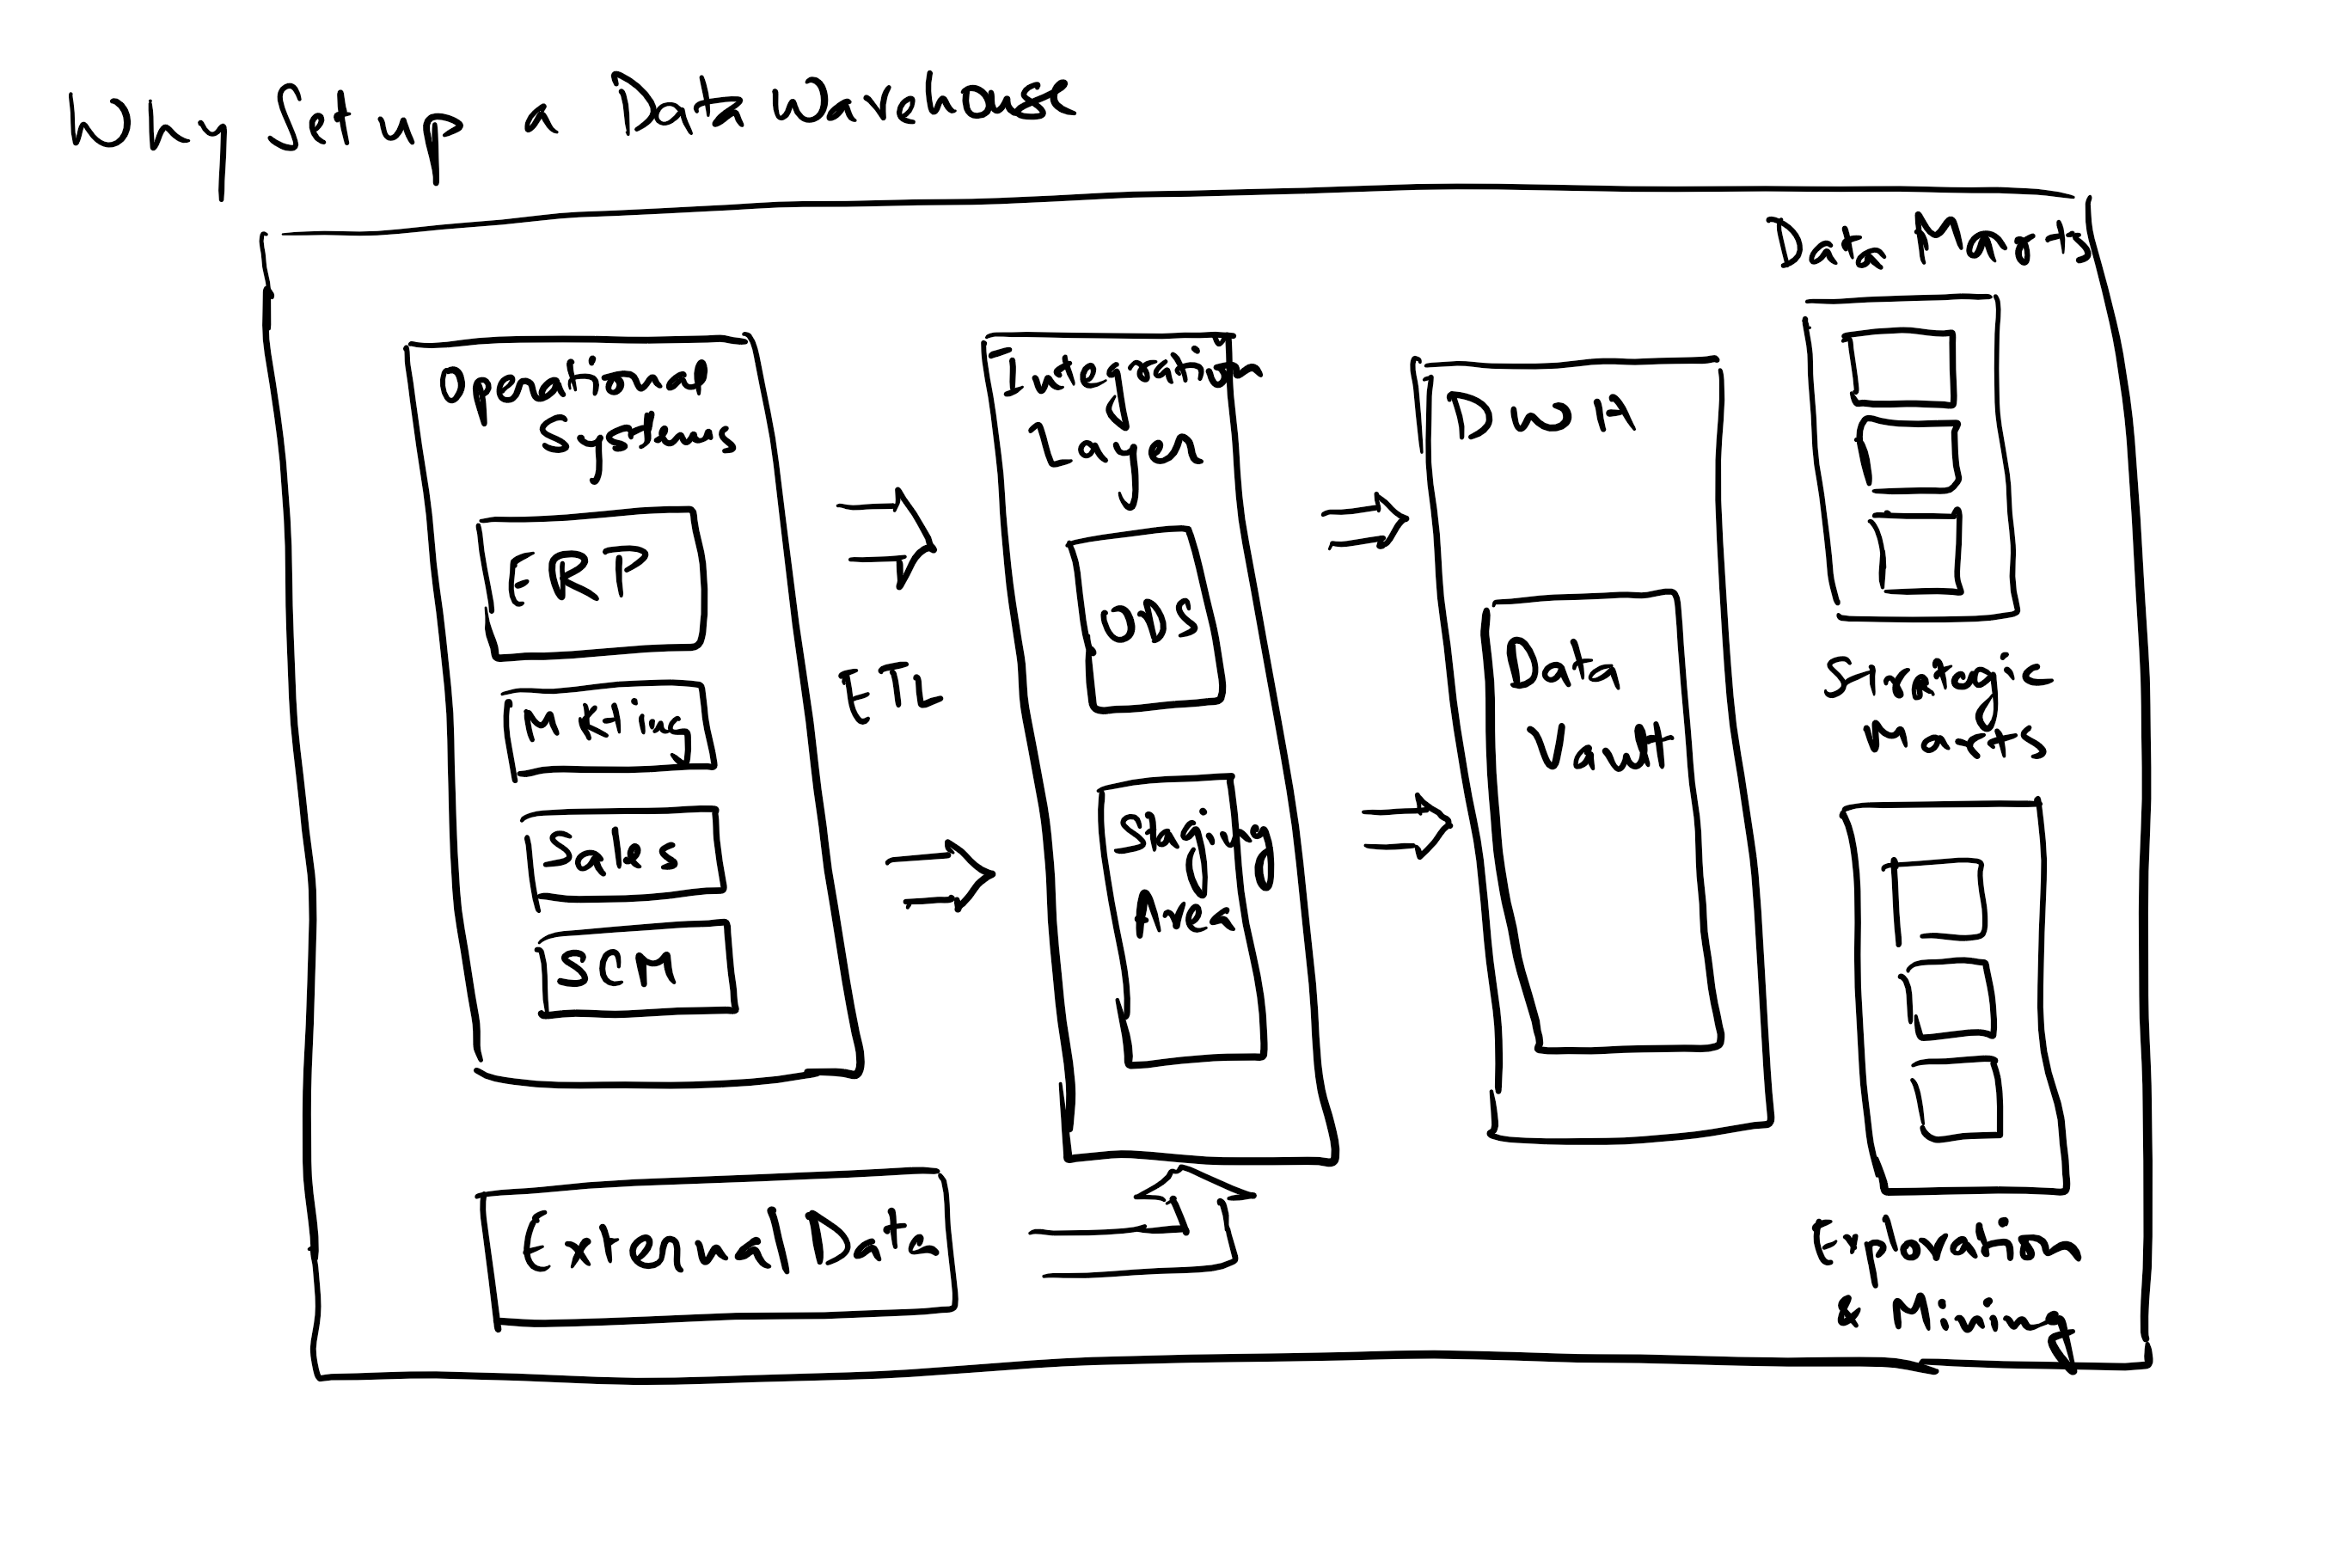
In 2006, we were at about 100MM prescriptions at mail order and about 765MM POS adjudications annually. To drive efficiencies, we digitized incoming Rx’s to route them to the closest mail order pharmacy location for dispensing in the most cost effective  way – so a patient on the west coast had their fill done from Las Vegas while a patient on the east coast would have our pharmacy in Tampa or Willingboro fulfill their order. 

Once we had the ability to digitize Rx’s, we were also able to group, sort or route to the most efficient way of doing business. We had the same ability with customer service phone calls coming in – recognizing the ANI allowed us to know who was calling and whether they had an order with our pharmacy. 

Since we also had a lot of patient data (Rx, medical claims etc.), we could stratify the patient population into various disease conditions, and if we used this stratification in routing prescriptions or calls, we had the ability to route all diabetics to a group of pharmacists that specialized in diabetes, or for neuropsych patients to the neuropsych TRC. Similarly we created the Cardiovascular, Oncology, Specialty and Women’s Health TRCs.   

We then discovered that our interactions with the patients were a lot more meaningful, with our pharmacists and CS representatives becoming trusted advisors to these patients. It also meant that we were able to keep patients more adherant on taking their prescriptions as well as intervene on behalf of the patients to request a gap in care intervention when we saw a missing therapy or course of actions. 

Using actuarial data, we were able to establish that while this intervention was more expensive than our regular cost effective dispensing and customer service operations, we were also able to improve patient health, bend the healthcare cost curve, reduce the adverse drug events and also introduce some new genetic testing as means of either avoiding certain treatments (using a genetic test (Abnormal CYP2D6 enzyme) before prescribing Tamoxifen for Breast Cancer treatments) or adjusting the dosage on some really poisonous ones (introducing genetic tests to regulate their dosage when a patient was first prescribed warfarin (a blood thinner)).

Given that our interventions were this effective and we had data to prove it, we introduced a product called TRC in 2007, which would entitle a client’s patients to our interventions, in return for a larger mail order penetration that drove our margins on the mail order side. This really helped both improve our margins as well as improve patient care.  

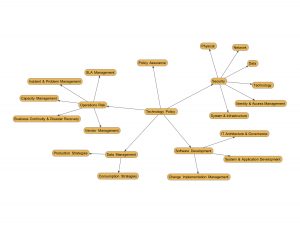
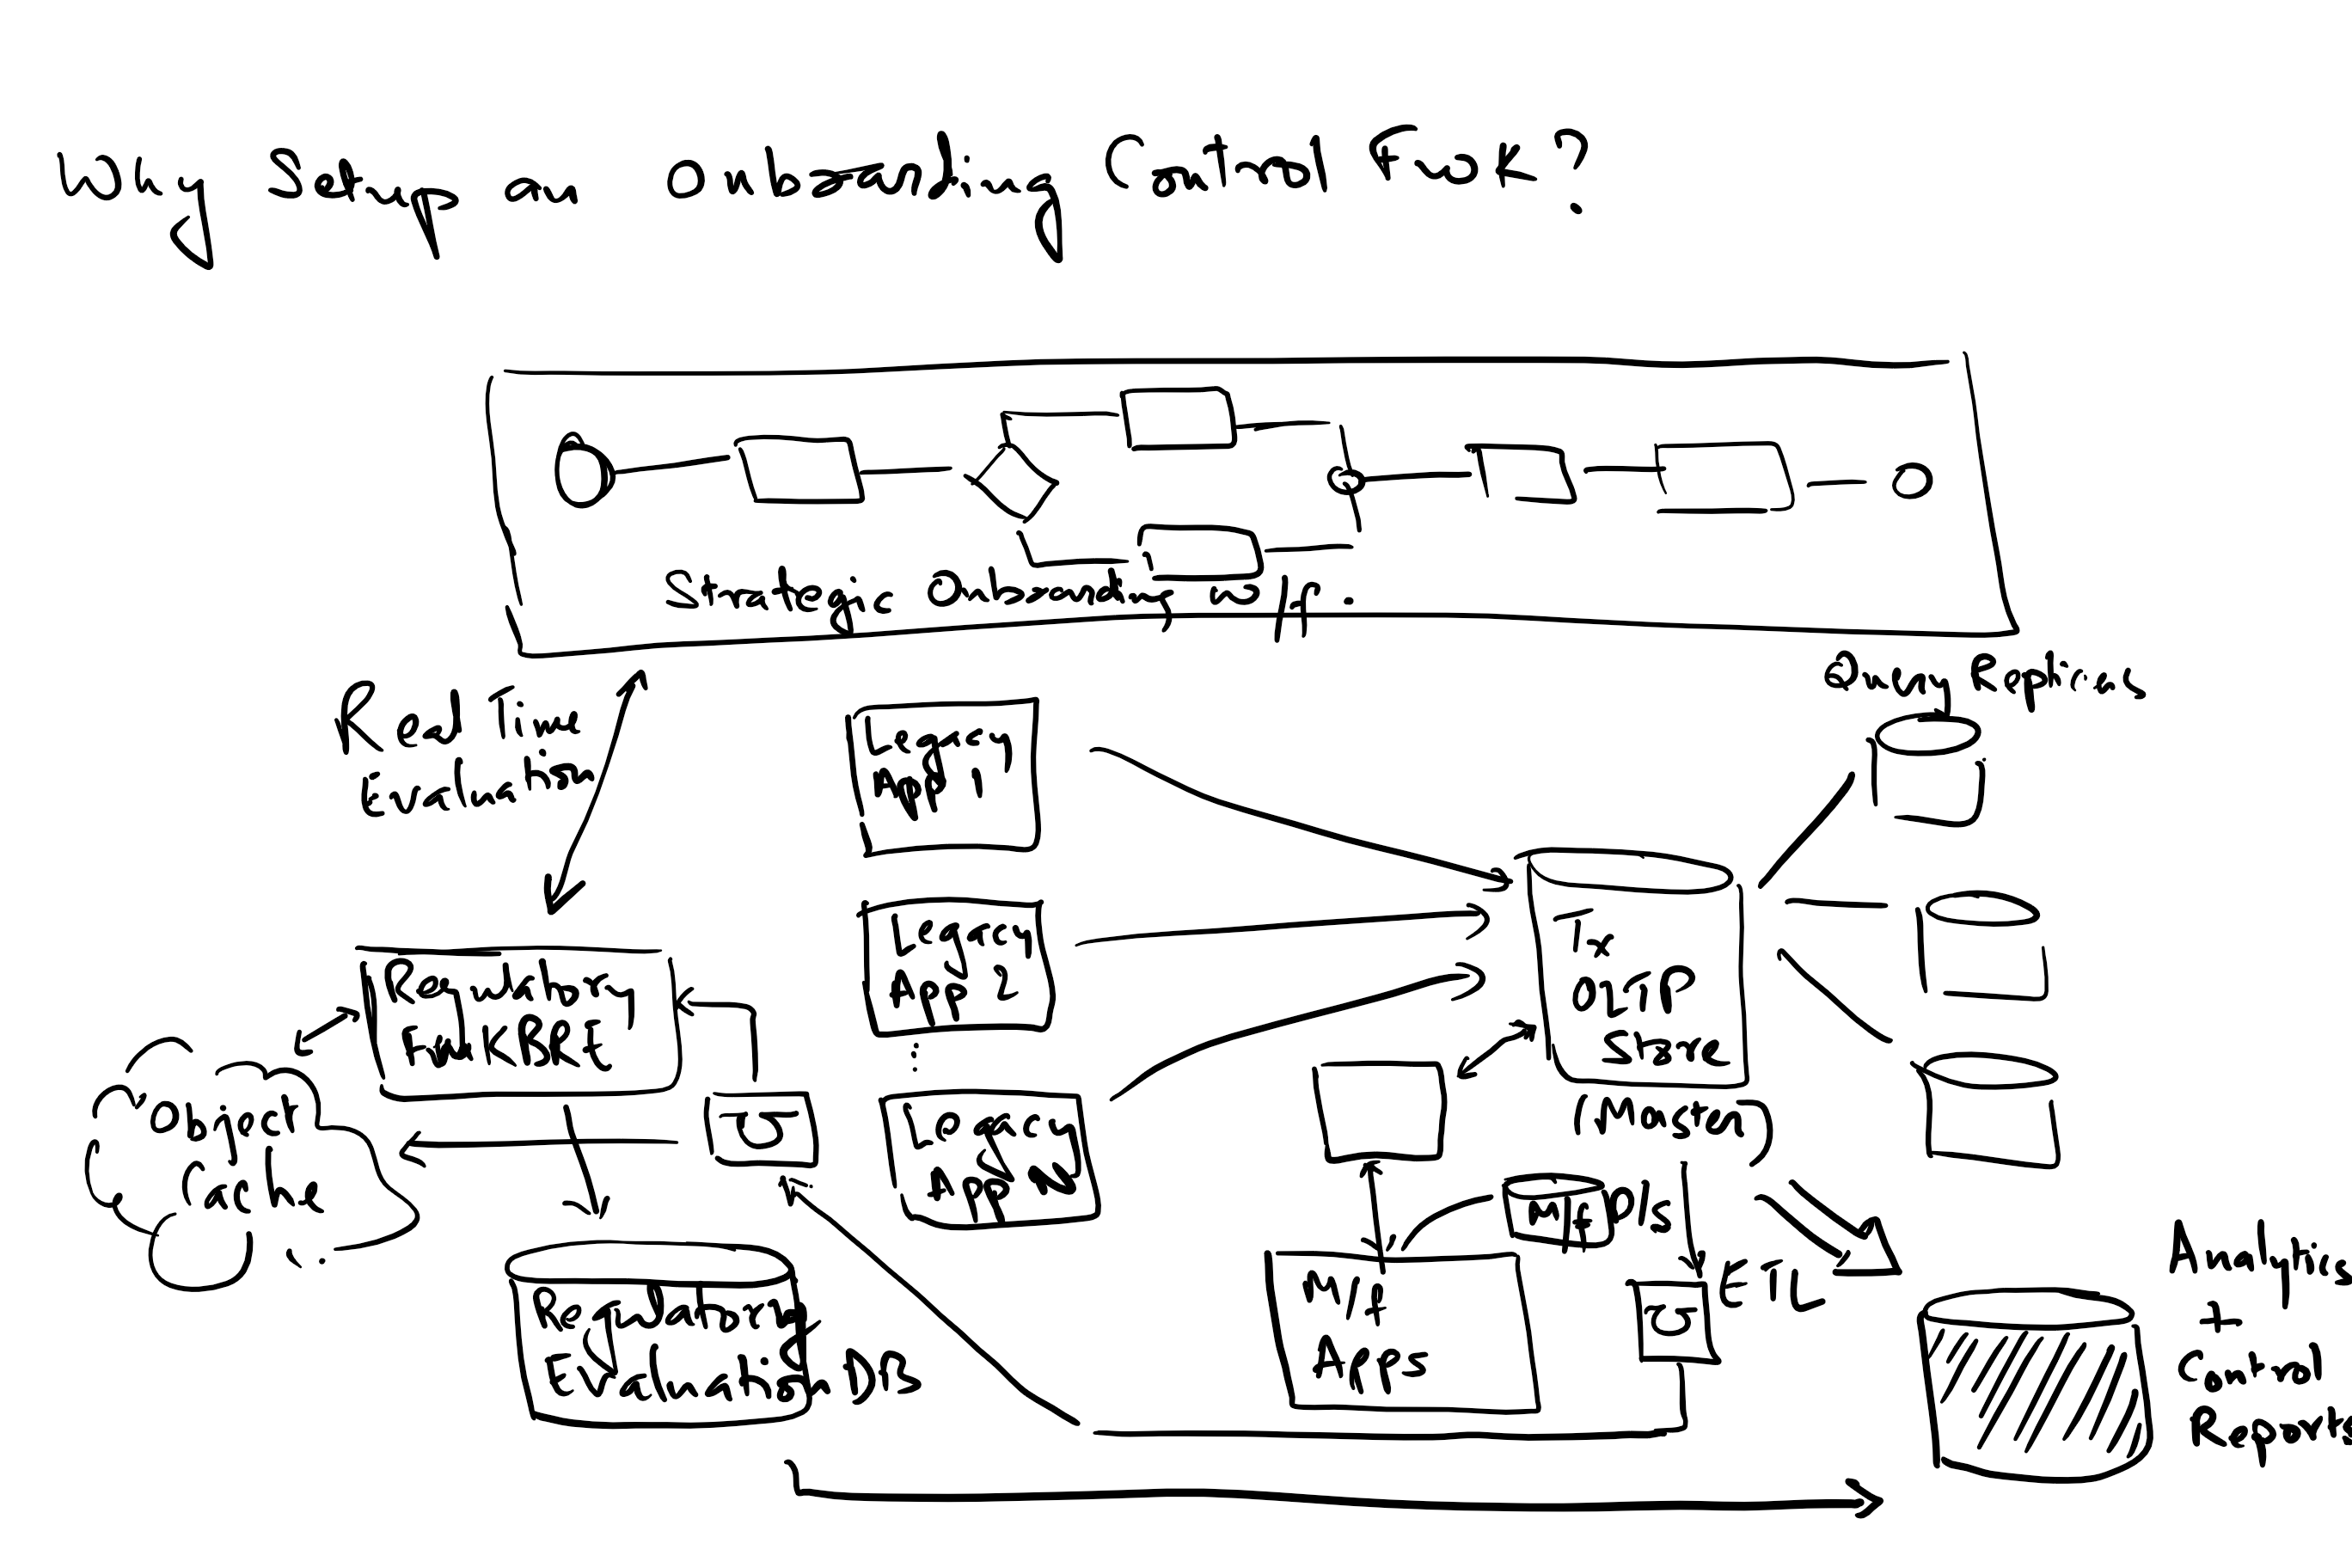
Medco’s Product’s & Services:

Therapeutic Resource Center Business Model:

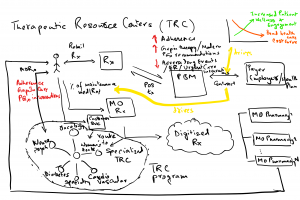
The above context diagram describes how our product worked, please do reach out if there are questions regarding how we designed this.

How Do We Transcend Our Time?

Yuval Noah Harari has a very interesting explanation for the success of human beings over other species –

  • The ability to collaborate in large numbers
  • The ability to weave stories i.e. be able to exist in multiple realities –

I would like to elaborate on the second point here. Think about it – the human life span is really short. How does one advance knowledge past a single human’s time scale – say a 100 years. There are two ways to transcend time –

  1. Encoding core information within our genome/DNA – allows for us to pass on to our progeny that certain traits have worked well to help us survive; Individuals with unfavorable genes / characteristics perish in this race for survival and with them goes the propagation of that combination of genes. A very good treatment of this is described in Siddhartha Roy’s “The Gene”
  2. Secondly we pass knowledge as stories (through language – verbal, written, mathematical, algebraic etc.). This allows for a child to continue to progress collection of knowledge without having to discover Newton’s laws or Einstien’s theory of relativity and build upon these fundamental tenets.

The above in my opinion has helped humans transcend time and have an impact much larger than the finite lifespan of a single human being.

We should therefore be thankful of the folklore, family stories, history that each of us is passed on by our ancestors.

Why Set Up A Data Warehouse?

What is a DataWarehouse? And why would you need one?

A data warehouse is a central repository that aggregates data from all transactional and other data sources within a firm, to create a historical archive of all of the firm’s data even when transactional systems have hard data retention constraints.

It provides for the following capabilities:

  • Aggregates data from disparate data sources into a single DB; hence a single query engine can be used to query, join, transform/transpose and present the data.
  • Mitigate the problem of database isolation level lock contention in transactional systems due to running of large analytical queries
  • Maintain data history even when source systems do not and provide a temporal view of the data
  • Ability to create trend reports comparing yoy (year over year) or qoq (quarter over quarter) performance for senior management
  • Improve data quality and drive a consistency in organization information – consistent code/description/ref names/values etc. Allows for flagging and fixing of data
  • Provide a single data model for all data regardless of source
  • Restructure data so that it makes sense to the business users
  • Restructure data to improve query performance
  • Add contextual value to operational systems and enterprise apps like CRMs or ERPs.

What is an Operational Data Store (ODS)?

An ODS is a database designed to integrate data from multiple sources. It allows for cleaning, resolving redundancy and integrity checking before additional operations. The data is then passed back to the operational systems and to the DWH for storage and reporting. It is usually designed to contain atomic or low level data such as transactions and prices and also has limited history which is captured real time or near real time. Much greater volume of data is stored in the DWH generally on a less frequent basis.

Why do we add Data/Strategic Marts to most modern data management platforms?

Data marts are fit for purpose access layers that support specific reporting use for individual teams or use cases for e.g. a sales and operations data mart, or a marketing strategy data mart. Usually a subset of the DWH, and very focused on the elements needed  for the purpose it is designed for. The usual reasons to create data marts are –

  • Easy access to frequently needed data with contentions
  • Creates a collective view for a group of users
  • Improves end user response times
  • Ease of creation and lower cost than a DWH
  • Potential users are well defined than in a full DWH
  • Less cluttered as it contains only business essential data

And finally what are Data Lakes and Swamps?

A single store of all the data in the Enterprise in its raw form. It is a method of storing data within a system or repository in its natural format and facilitates the colocation of data in various schemas, structured and unstructured in files or object blobs or data bases. A deteriorated data lake, inaccessible to its intended users and of no value is called a “data swamp”.

How Do You Turn Around A Team Not Performing Well?

The first thing needed is an assessment of what’s wrong. My advice is to meet with each member of the team individually, make your own assessment of the information you are receiving. A few key dimensions to collect and assess are team structure, individual assignments and roles (whether the team has the right skill sets, are they motivated in their roles and are there any prevalent bad attitudes), and leadership style within the team. Also note the current success and failures  of the team.

What has worked well for me in the past is to define a mission statement for the team – what are we trying to do and why? Each member of the team should be able to state and defend the mission and why its critical. A shared understanding and buy in is critical for the team to rally around and cooperate. Remember the Star Trek Enterprise episodes always started with their mission statement – “Space, the final frontier. These are the voyages of the starship Enterprise. Its 5-year mission: to explore strange new worlds, to seek out new life and new civilizations, to boldly go where no man has gone before.”

Define SMART (first defined at GE) and Stretch goals. Smart goals are specific, measurable, achievable, realistic and timeline based. Stretch on the other hand may appear to be more than possible, but are the ones that spark remarkable innovations.

Setup team norms that ensure psychological safety (Charles Duhigg – Smarter, Faster, Better – The Transformative Power of Real Productivity). The following is an excerpt from the book that describes this concept and some of the other critical building blocks for a high performing team:  A team climate characterized by interpersonal trust and mutual respect in which people are comfortable being themselves.

1. Teams need to believe that their work is important.

2. Teams need to feel their work is personally meaningful.

3. Teams need clear goals and defined roles.

4. Team members need to know they can depend on one another.

5. But, most important, teams need psychological safety.

Where “Psychological safety” is a shared belief, held by members of a team, that the group is a safe place for taking risks. It is a sense of confidence that the team will not embarrass, reject, or punish someone for speaking up.

Next address the tactical issues of failures and risks. Secure stakeholder agreements to ensure that targets are achievable. Reassign or repurpose team members with bad attitudes.

Some general principles that have helped me throughout my career are as follows –

  • Keep criticism private
  • Roll up your sleeves and get in the trenches
  • Achieve short term wins; Praise achievements and celebrate
  • Inspire and motivate – “We can and We will”

Finally measure what you value and put it in a cycle for continuous improvement.

For example, for an IT team, the metrics to measure may be the following:

  • Cadence of delivery
  • Delivery throughput
  • Quality of code delivered
  • Stability of the application/platform/system
  • Scalability
  • Usability measure
  • Business continuity
  • TCO – total cost of ownership

While for a product team, you may want to measure and improve these:

  • Effective product lifecycle management
  • Product market position
  • Rate of new / modified products being introduced
  • Success rate for new / modified products
  • Ability to deco/sunset loss making products

Or for an Operations team, the following may be relevant measures:

  • Cost per unit work
  • Quality per unit work and rework %
  • Risk mitigation/avoidance and quality tolerance
  • Average turnover in the team and morale

As always, feedback is always welcome…

Why On-Boarding Applications Require A Consistent Framework?

My bank has been trying to solve on-boarding for the last 25 years via a variety of on-boarding systems. Given the vagaries of budget cycles, people’s preferences and technology choices, we ended up with over 10-15 systems that did on boarding for specific products, regions and type of clients like Commodities / FX / Derivatives / Options / Swaps / Forwards / Prime Brokerage / OTC Clearing etc. With increased regulations especially FATCA (which I was hired to implement) meant wasteful and fractured capital expenditure in retrofitting each of these 10+ systems to be compliant with regulations. 

To address this, I made the case for going to a single on-boarding platform, where we could maximize feature reuse, optimize investment and be nimble with the capabilities we were rolling out. I refocused the team to move on boarding to this single platform called “The Pipe”. This included negotiating with stakeholders to agree on bare minimum functionality that would let them move to pipe. 

Ensured that all new feature development happened only on the go forward strategic platform. Designed an observer pattern to create FATCA cases (and later every other regulatory case) only on the pipe platform regardless of where the account or client was on-boarded.  This allowed for functionality on the legacy systems to be stymied and for our business to easily move over to the strategic platform. 

We streamlined delivery of functionality into a regular 4-week monthly development cycle followed by a test and deployment cycle. Achieved 99+% of all new client accounts being on-boarded on the pipe platform. Created a common regulatory platform that allows for all reg cases being created on the Pipe platform regardless of where it was created/updated. We were able to streamline development to rollout a new regulatory program in a single release cycle, which otherwise would have taken a project running for a year or more to implement. This helped us rationalize investment and also provided assurance to my business around regulatory compliance; 

Happy to share details around the challenges we faced and the strategies we employed to overcome them.

As always, I welcome any comments or compare notes on a similar situation that you may have come across.

Healthcare Value Chain Innovation? An alternative model

What is ailing the healthcare market? Why do we(Americans) pay higher per capita for treating a disease condition? Is it just because we have access to the most innovative solutions? Do we have misaligned incentives? Is all the work that is done in the healthcare value chain value added work? Or are we classifying busy work as value add when all it’s doing is to sustain an over complicated system that existing players have an incentive to maintain.
Let’s talk about what ails healthcare. Why is it fundamentally a different kind of product? Why do the normal rules of market competition and capitalism not apply here?
  1. When someone needs acute treatment, the consumer usually does not have the time to shop around. For e.g. when a patient is in an ambulance for being treated for a heart attack – its not the time he/she checks the scores for the nearby hospitals about how cost effective they are or whether they provide value for money.
  2. It appears to be a zero sum competition – In which gains of one system participant come at the expense of others. This kind of competition does not create value for patients, but erodes quality, limits access, fosters inefficiency, creates excess capacity, drives up administrative costs among other nefarious effects. Why can providers of diabetes meters and wheel chairs advertise to the Medicare eligible patient community offering free stuff at Medicare’s expense. Why does CMS not have the ability to negotiate rates for common services given the volume it commands?
  3. Who is the consumer and who is actually making the decision on consumption? Healthcare products are not ordered by end consumers – Orders by workers on the frontline of healthcare delivery such as physicians, nurses and so on. Purchasing is thus not an organizational competence, let alone a core competence but rather the domain of non-business people.
  4. The provider industry is largely based on non profit ownership – No real emphasis on budgeting, process improvement or IT optimization. Also since a large portion of provider revenues flow from federal and state governments, some believe that providers have developed a welfare mentality rather than strong profit and loss mindset.
  5. Fragmented Industry – Despite consolidation, it is still a fragmented industry with no real leadership at any stage. Fragmentation complicates the task of connecting thousands of parties involved at each stage in the chain, and standardizing the format and content of their business transactions.
  6. Providers made investments in patient care rather than technology –  Procurement and other functions are based in dated legacy systems with little direct connectivity with manufacturers. Product master catalogs are often paper based, and their contents (product descriptions, prices) typically differ across players in the chain due to time lags in relaying and uploading new product and contract information.
  7. Treating the value chain as a supply chain and the focus of manufacturers on creating demand for a product using a push model rather than a pull model.
  8. Lack of transparency through negotiated contracts, pricing agreements and no easy way for a patient to tell what a healthcare product should actually cost.
Let’s imagine alternate models – one based on capitalism and competition (but unfettered and unconstrained). Another socialist but efficient universal healthcare.
To choose we must define what our core principles are as a society – do we consider healthcare a “right” or a “privilege”.
If it’s a privilege then why do we insist on the Hippocratic Oath – why can’t emergency rooms turn away dying patients unless they can pay upfront?
If it’s a right, then why should we not use the most efficient way delivering and  paying for healthcare? From a payment perspective, having a single payer for basic services is probably the most efficient, given the benefits of scale.
A combination of the two may be best suited for us – where basic healthcare and pursuit of the Hippocratic oath may be a base guarantee by the government (basic healthcare as a right), while add ons are optional and at the patient’s discretion for which they can choose to procure insurance – for e.g.  the type of room or facility you check into when being admitted for a procedure. Or the choice of a certain brand of a product that may be above and beyond what basic coverage is available for free.
Also allow for vertical integration across the value chain and let larger end to end entities compete. Remove the incentive of manufacturers to push product, instead they become a part of competing value chains they may compete in treatment levels that are simple, standard or complex.
In addition, the following steps should help make our healthcare delivery systems effective, efficient and outcome based for the patient.
  1. Establish the right (and mutually agreed upon) objectives for each player in the market.
  2. Simplify the market, regulations and system to only allow value added activities rather than the labyrinth of activities in current state for e.g. managing rebates, claw backs, pay backs as a way of keeping incentives for all players in line.
  3. Build transparency and an easy objective way of comparing value.
  4. Move from a manufacturing supply chain to a value chain way of operating.
  5. Analyze 3 critical flows – product, money and information for driving towards efficiency.
  6. Set up profit incentives for all players to become efficient and effective in their operations.
This is an extremely complicated topic and two of the books that have greatly influenced my thinking are Redefining Healthcare by Michael Porter and Elizabeth Teisberg and Healthcare Value Chains: Producers, Purchasers and Providers by Lawton R Burns at Wharton in addition to my own experience navigating this space in various roles at a PBM.
There may not be a silver bullet, but through debate, discussion and action we could move our healthcare system to a place where it delivers for its main beneficiary – “The Patient”.
Happy to receive feedback and look forward to a meaningful dialog…

Context Is Important

Knowing your Business Context is key to Product Development.

What is business Context?

Business context is the sum total of conditions that exist in the market – the availability/lack of capital, the demand (customer), supply (competition), your own capabilities (people, process, systems & technology), availability of patents, trade secrets or trade marks, brand access, product lifecycle, supply chain for how your product is assembled, sales, marketing & distribution channels, and other external forces like regulations, government policy.

It allows for you to be able to reconfigure your capabilities to affect business model innovation. A simple context diagram like the following goes a long way towards helping you gain consensus among practitioners, stakeholders and customers.
An organization has its own culture. Understanding power structures and organizational context is critical to being able to innovate. You will need budget, capabilities, resources, and buyin to get anything done. Navigating the corporate labyrinth can only be achieved through selling your ideas.
The following is an example of how we changed the game by introducing a product like Therapeutic Resource Centers into a standard utility business like a PBM.
We have created a proprietary framework to help sell your ideas.  Here is an example of the framework which I have used in the past to validate our strategy.

Update from RoboCup 2018 – Montreal CA

My son’s team had qualified for the rescue line competition at the international RoboCup 2018 competition in Montreal Canada. While his team did not do as well (26 out of 38 teams) – it was a great learning experience. Since it was our first international competition, we were also awed by the level of the competition as well as the advanced robotics capabilities on display.

Here’s a description of some of the advances we saw at the conference.

Tickets:

We got tickets early in the morning on Sunday June 17th, and the rest of the day went in team setup, practice runs and calibration & tuning the robotics programs.

Setup:

Sunday, June 17 was for setup at the Palais De Congres in Montreal.

Rescue Line Competition:

The competition primarily consisted of teams building their own bots to navigate a variety of challenges like line tracing, navigating left, right and U turns, navigating road bumps, debris and obstacles, tackling ramps, bridges etc. In addition being able to score points in the rescue room by identifying victims and carrying them to the respective rescue zones. All of this was to be available as capabilities of the bot and to use sensors to autonomously navigate through the obstacle course and accomplish the above mentioned tasks.

Rescue Line Winning Team – Iranian Kawash. The following is a video of their winning robot in the rescue zone.

Sid’s Team run –

Winning Robot: Team Kavosh from Iran

Rescue Maze Competition:

The objective of the rescue maze competition is for a robot to navigate a complex maze and identify victims to save.

Team Soccer:

Autonomous bots in a team playing soccer. The soccer tournament came a various levels –

Middle Size League:

Powerful bots playing soccer with a full size soccer ball. Here’s a video of a 
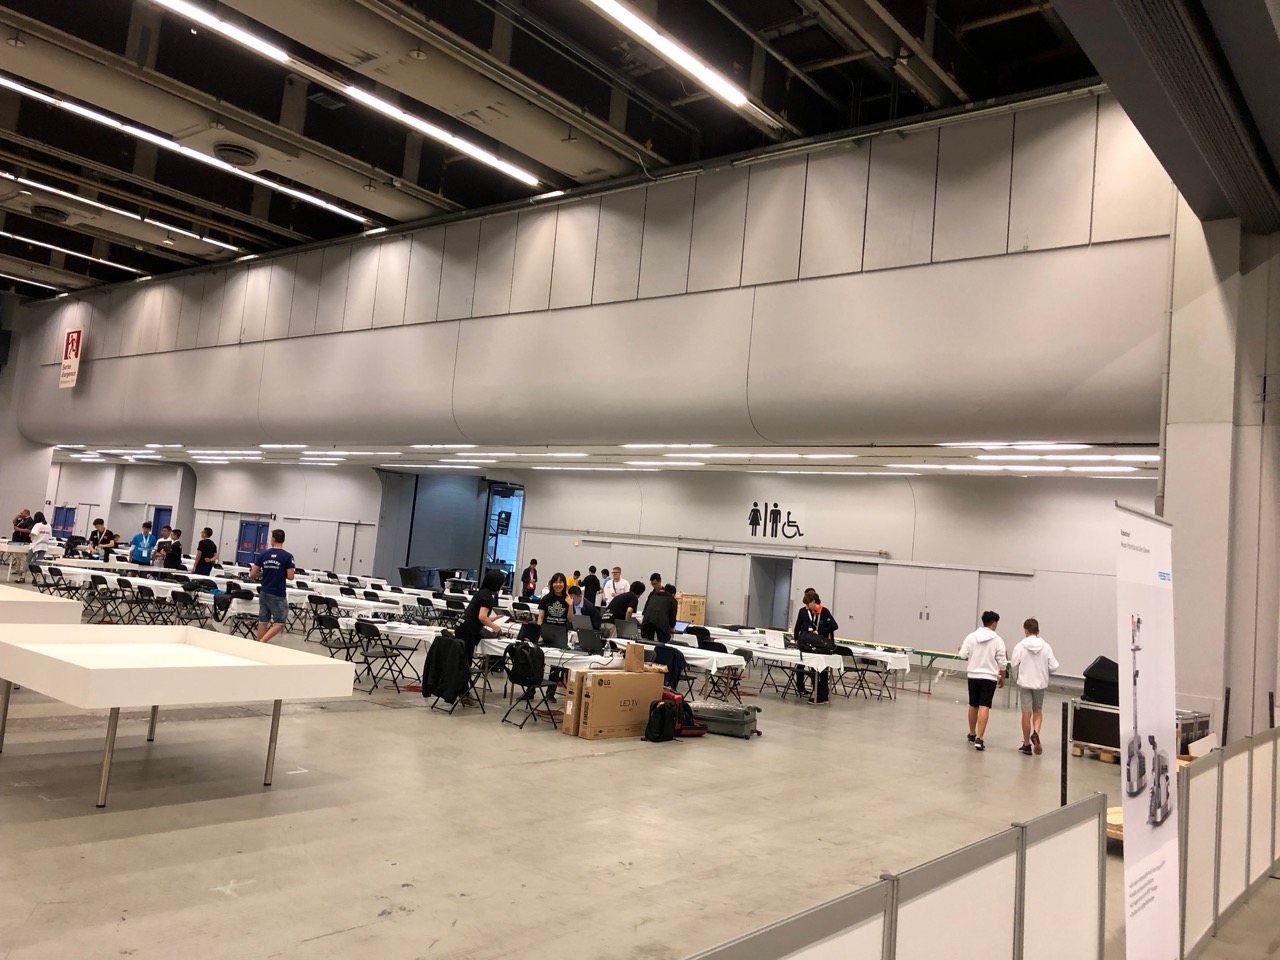
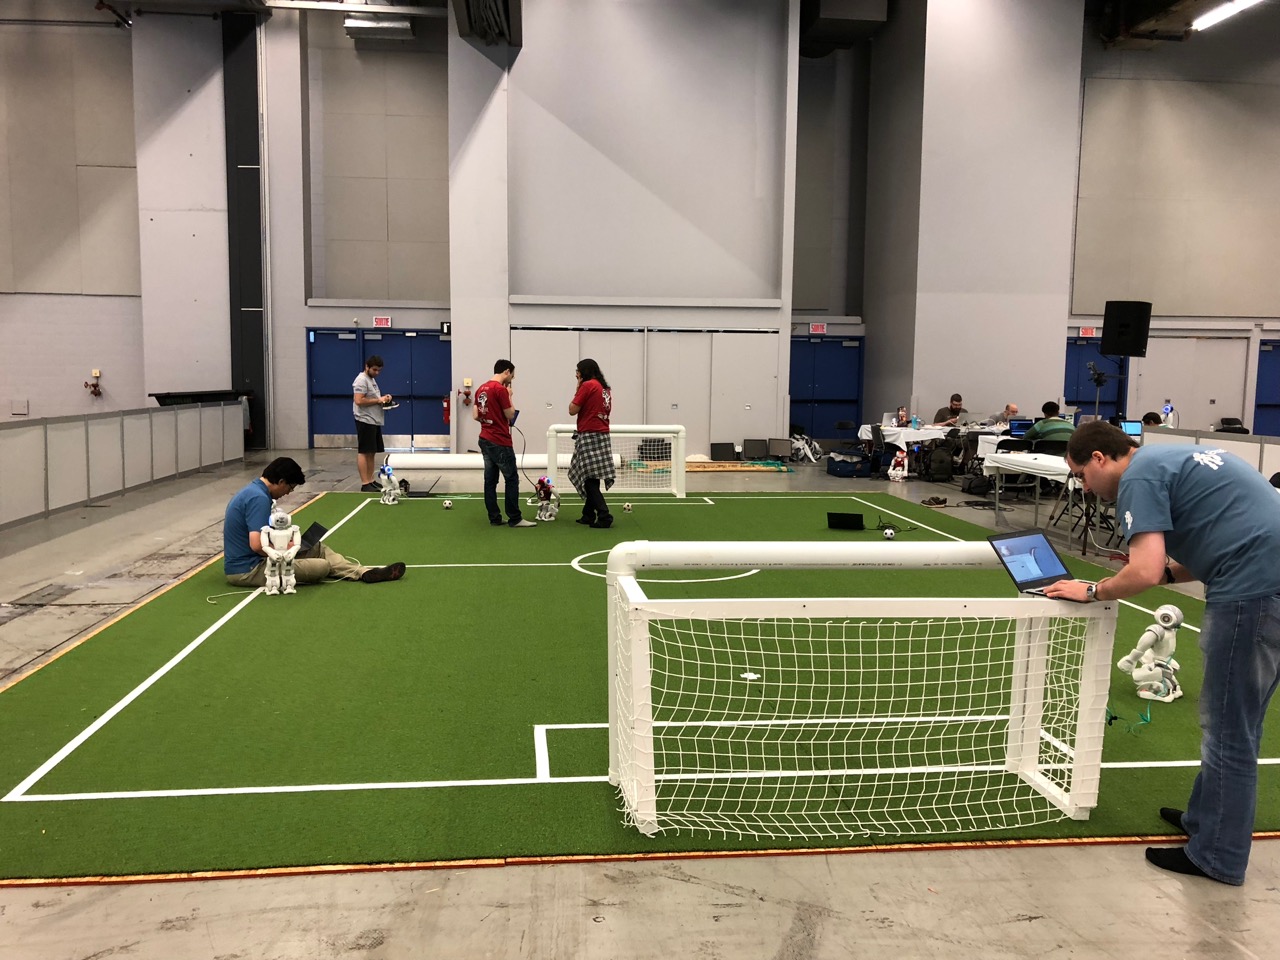
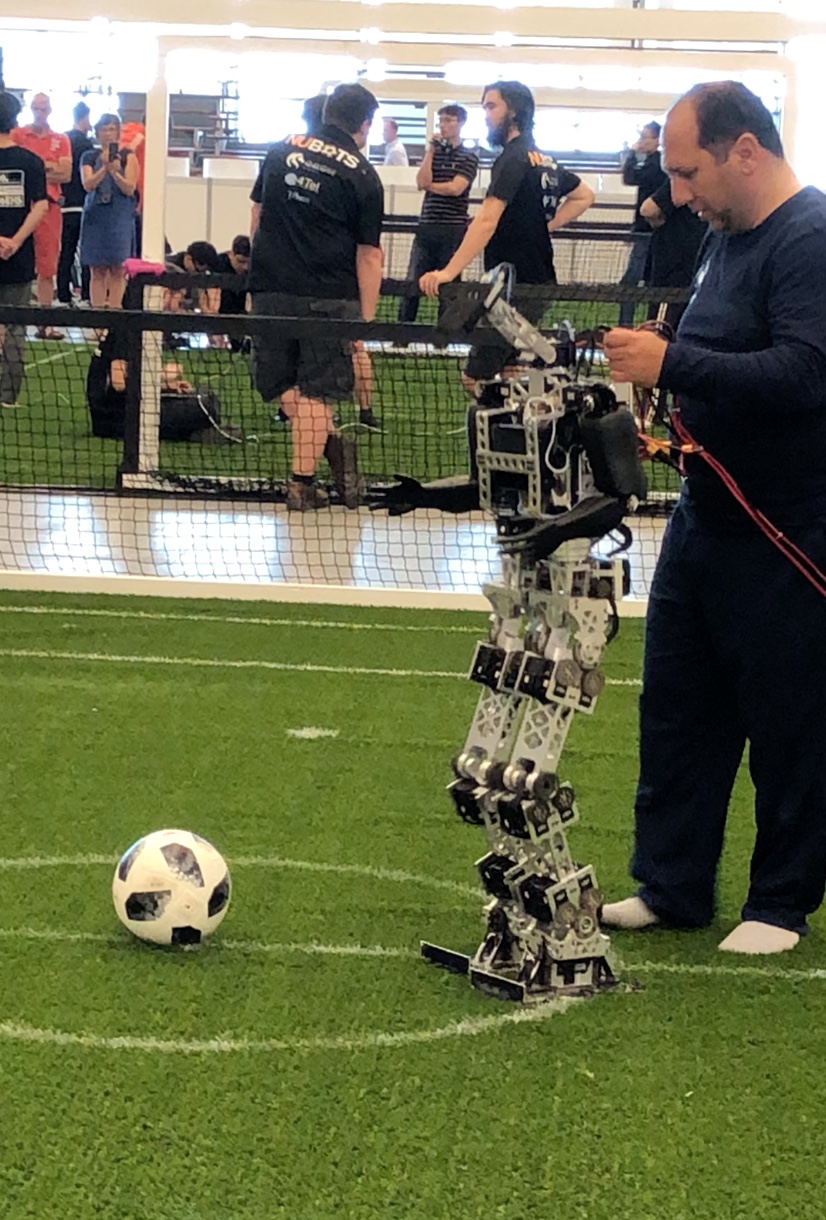
goal from one of the teams.

Junior League:

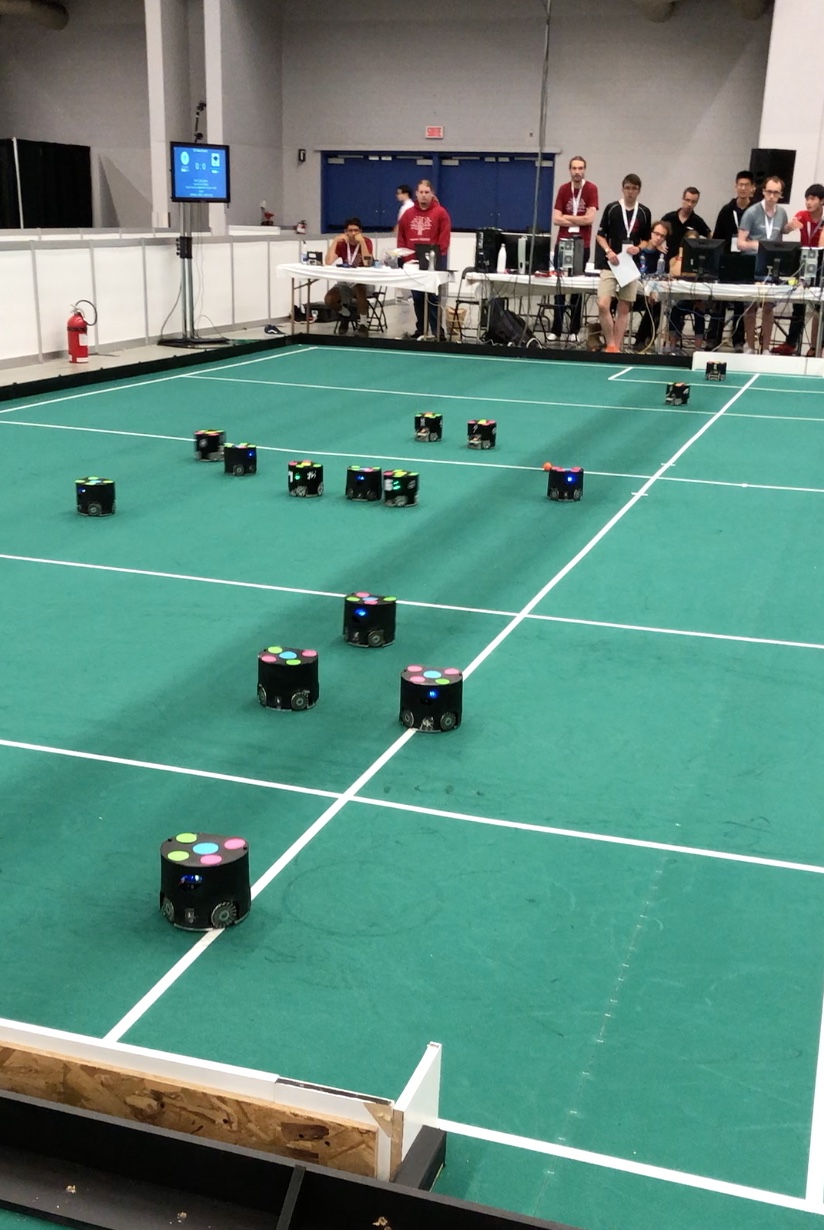
A very fast paced soccer game with bots acting in coordination as one team against an opposing team. Here’s a video that shows how exciting this can be.

Humanoid Robot Soccer:

There were three categories – Kidsize Humanoid League, Humanoid League

and Standard Platform League. There were mainly two challenges – building a humanoid robot to navigate locomotion challenges of walking while controlling and navigating a ball towards the opponents goal. The Standard Platform (for e.g. using Softbank’s NAO Generation 4) to play as a team the full soccer match. These looked like toddlers who were navigating the challenges of walking, coordinating, sensing and controlling the ball and  shooting goals. Overall it was great fun to watch! Do check out the videos below.


Industrial Robots and Others at Work and Home settings:

We saw a number of demonstrations from a number of different companies on industrial robotics. A few are described in the following videos.

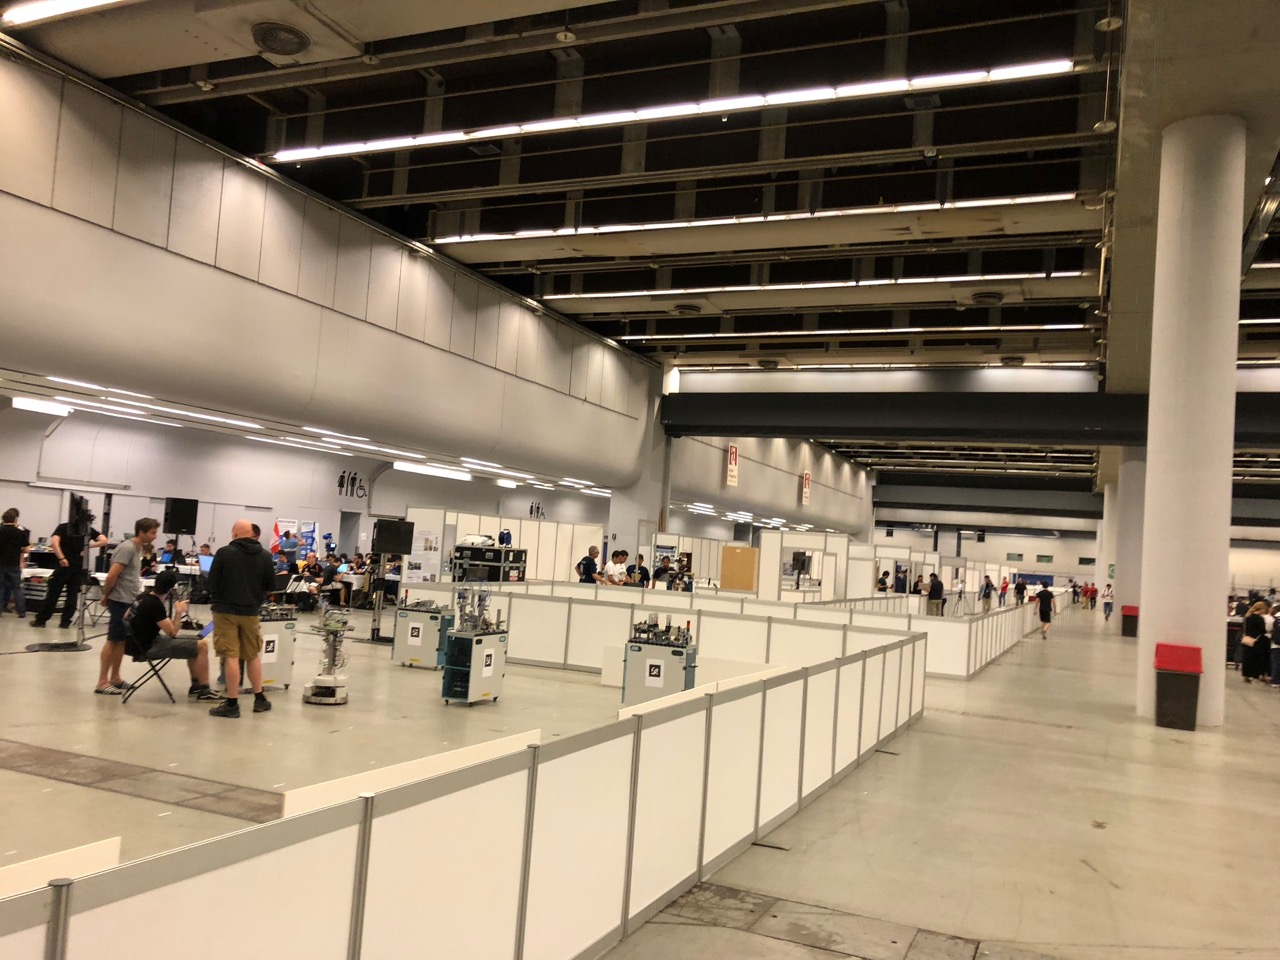
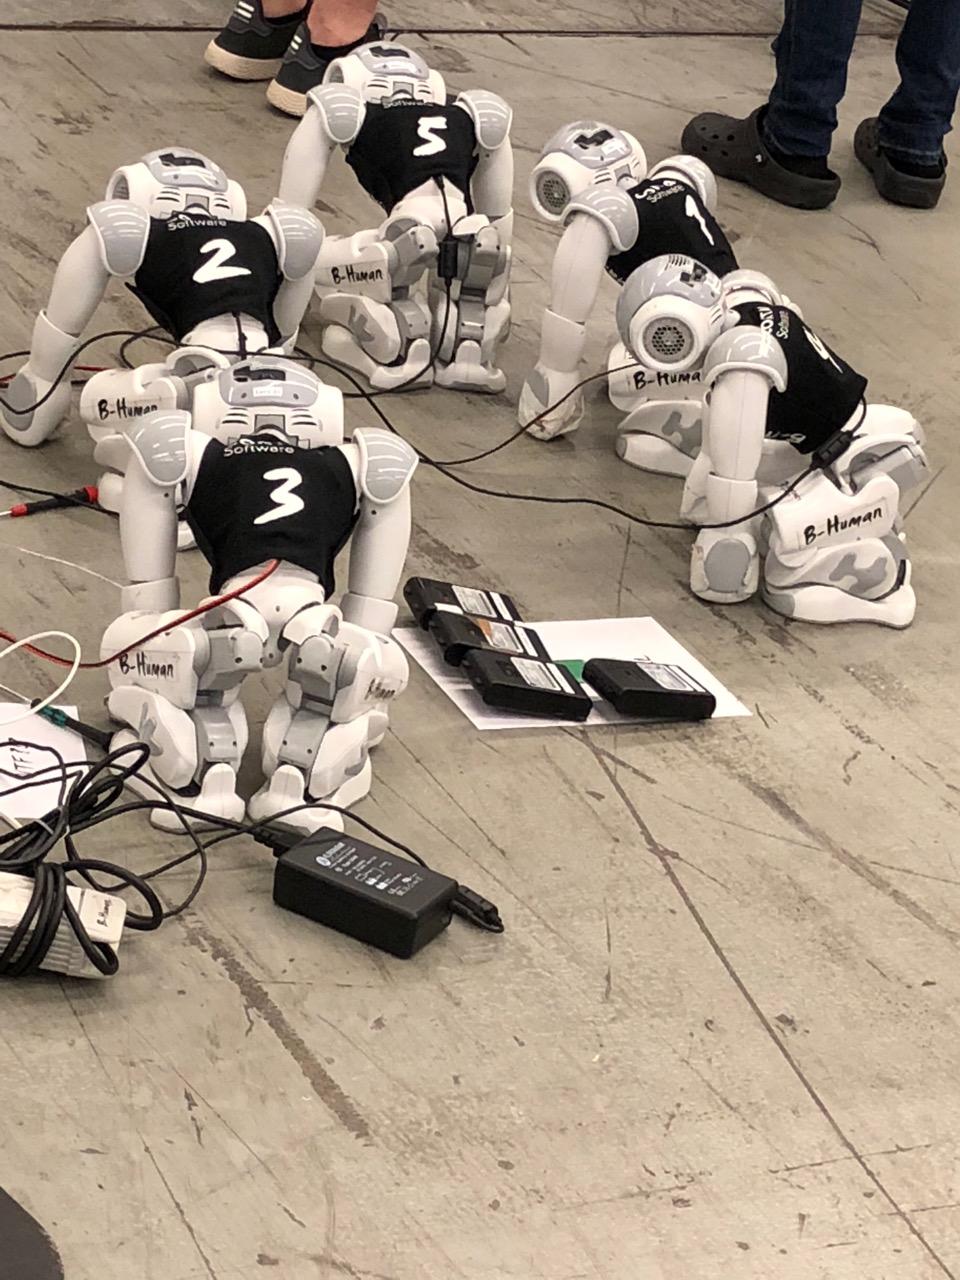
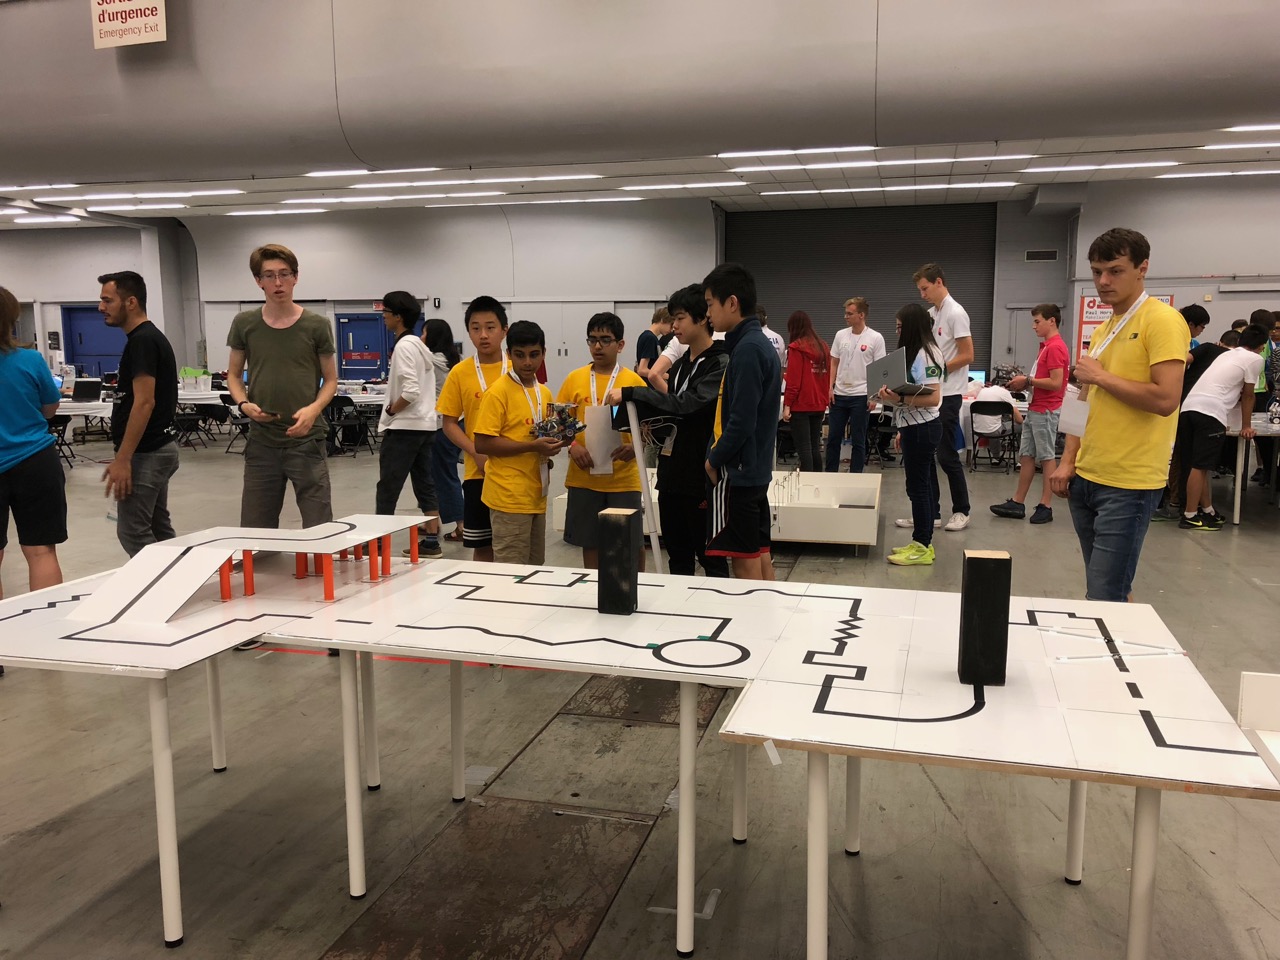
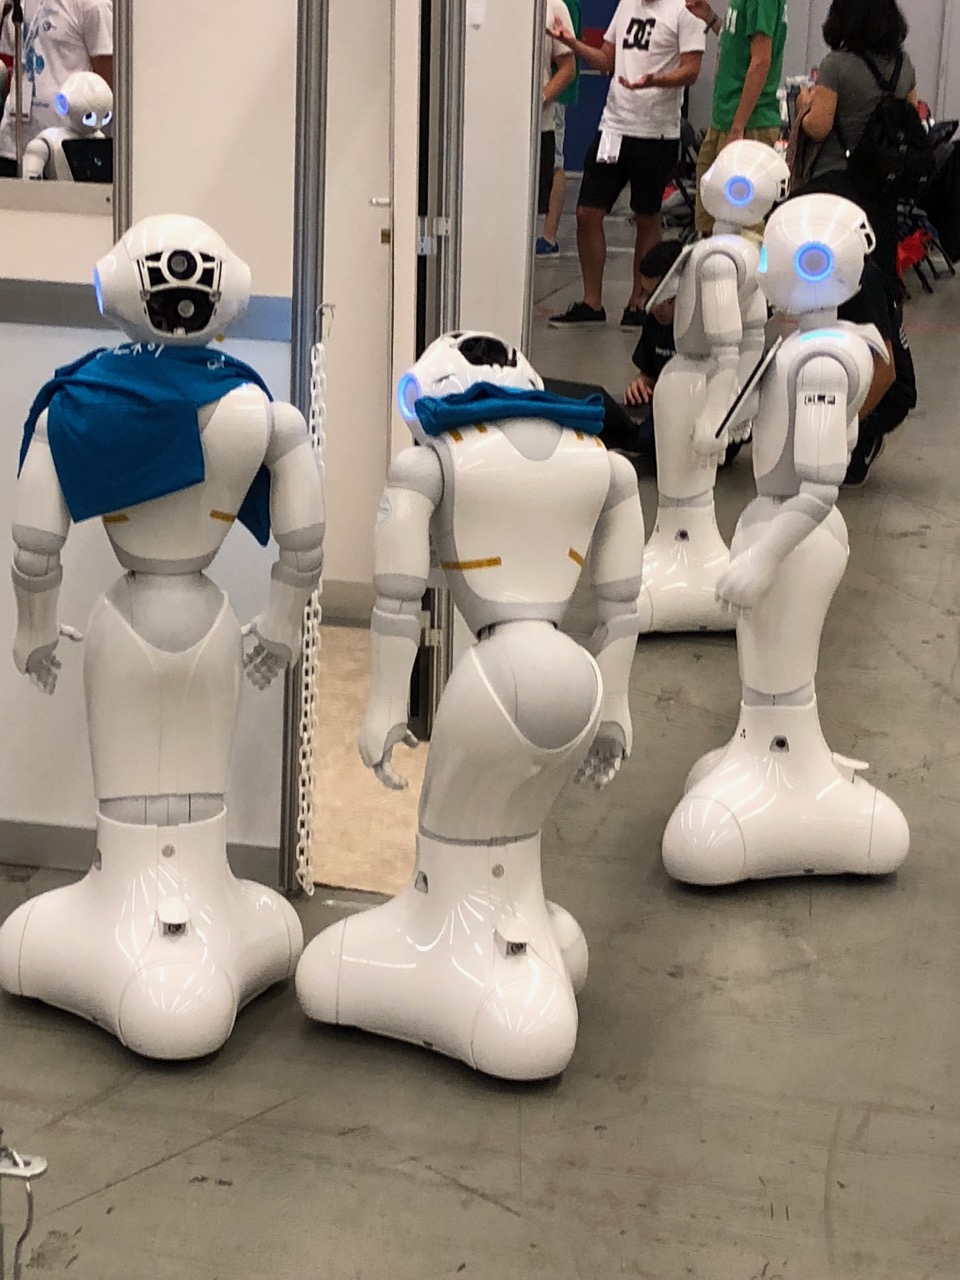
There were a number of other home setting 
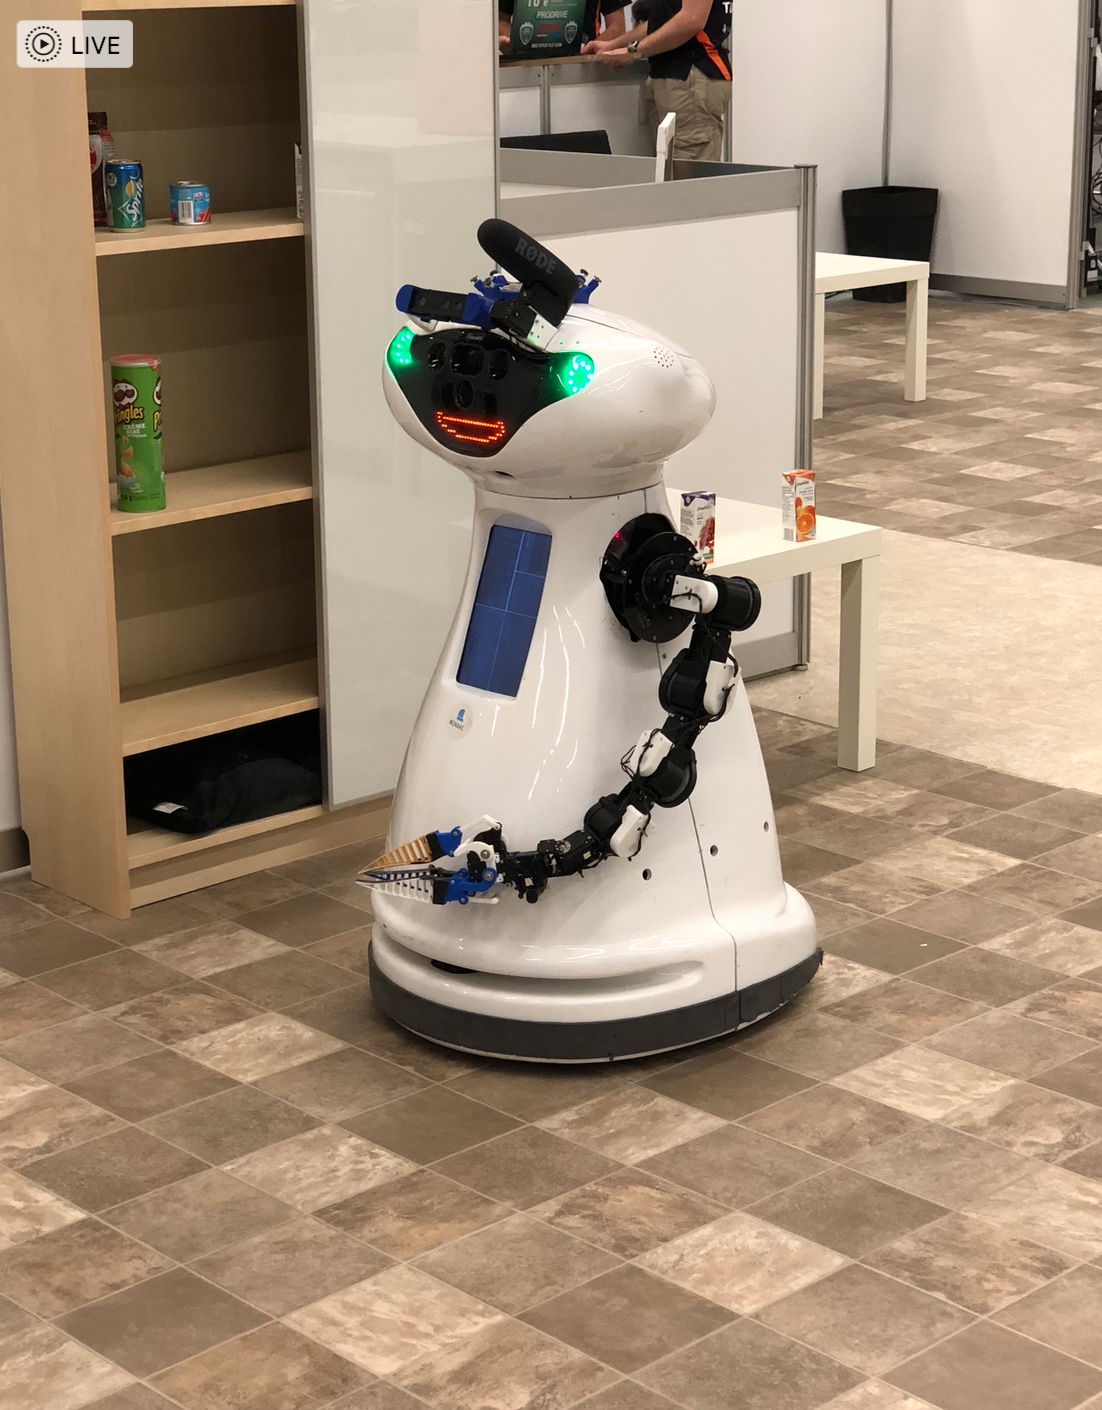
challenges as well – for example unloading grocery bags and storing them in the right location/shelf in a home.

Rescue Robot League:

Navigating difficult terrain robots: These are primarily demonstrations of how 
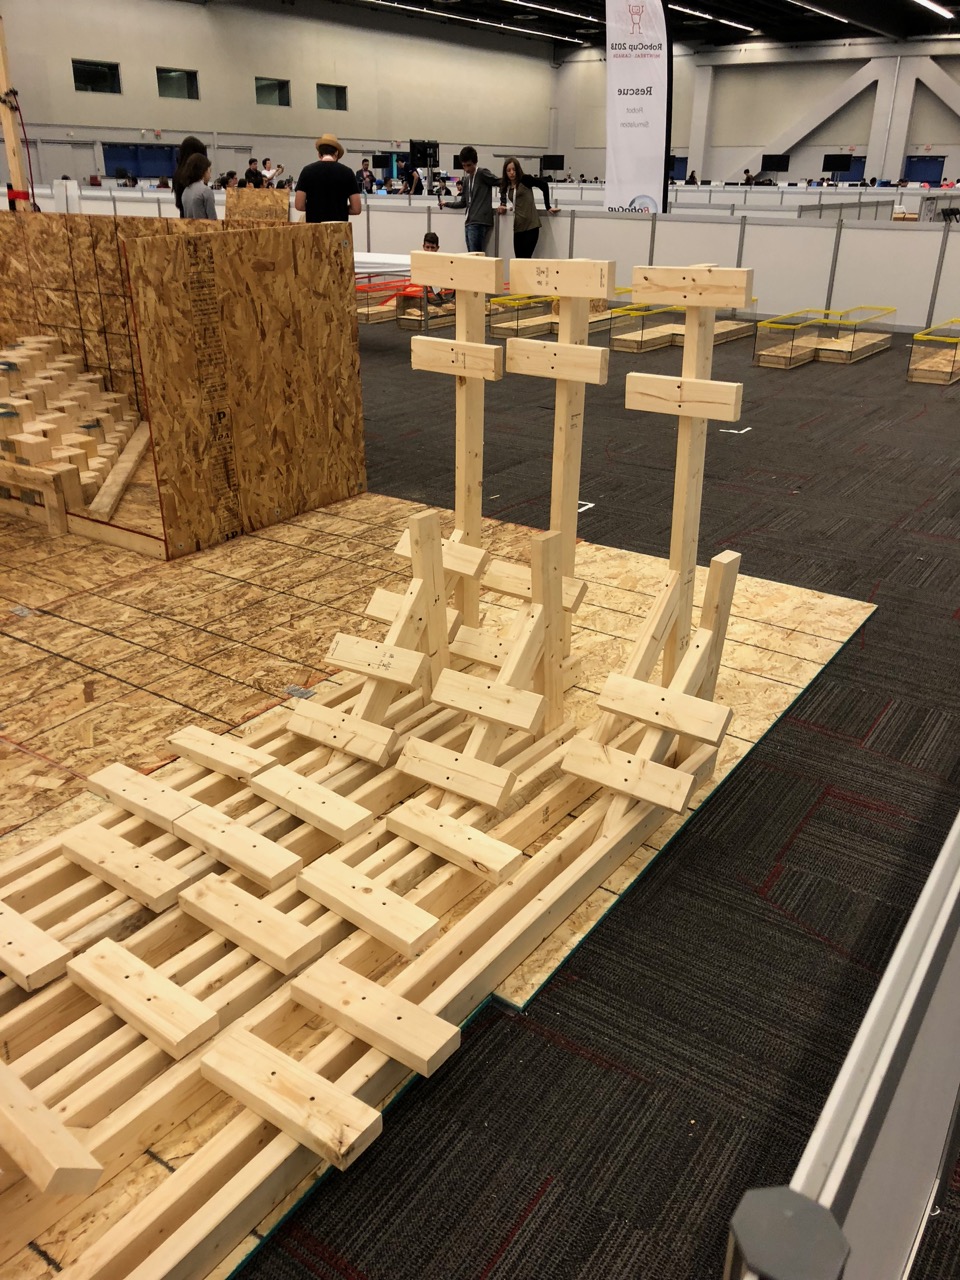
bots can be used in a hazardous situation for rescue. Challenges included navigating difficult terrains, opening doors, accomplishing tasks such as sensor readings, mapping a maze or path through the field etc. Some videos listed here are very impressive. These teams were mainly university and research lab teams. Do check out the following links.


Sponsors:

Softbank was a big sponsor at the event.

It has made huge investments into robotics. It will be evident from the following videos that making these investments is critical to succeeding in the near future when we expect a lot of the mundane work to be automated and mechanized.


Closing thoughts:

We saw that we were competing against a number of national teams. There is 
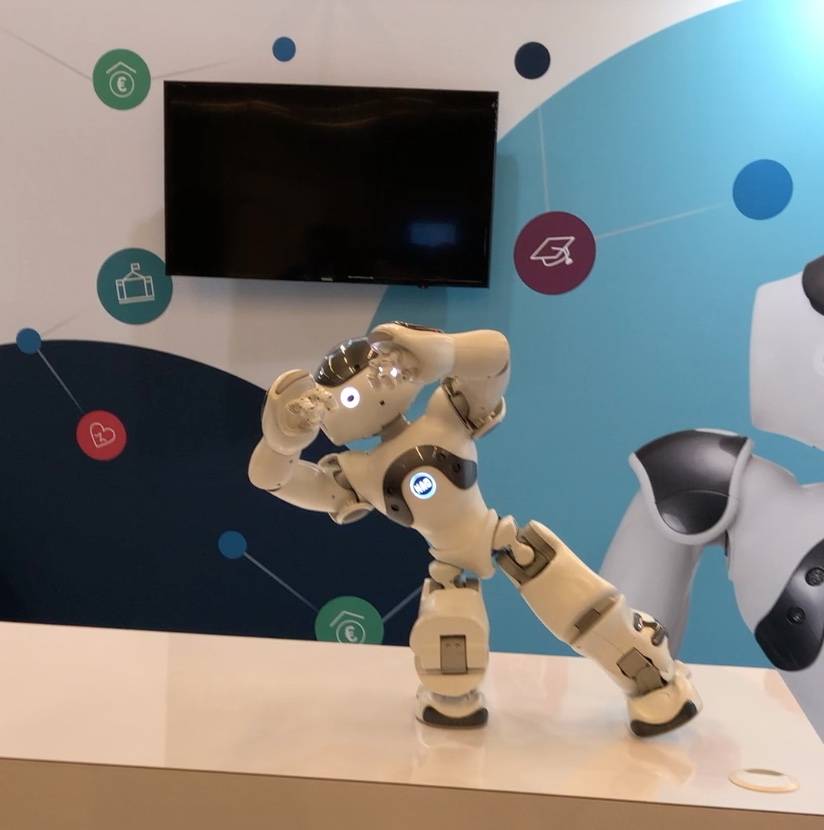
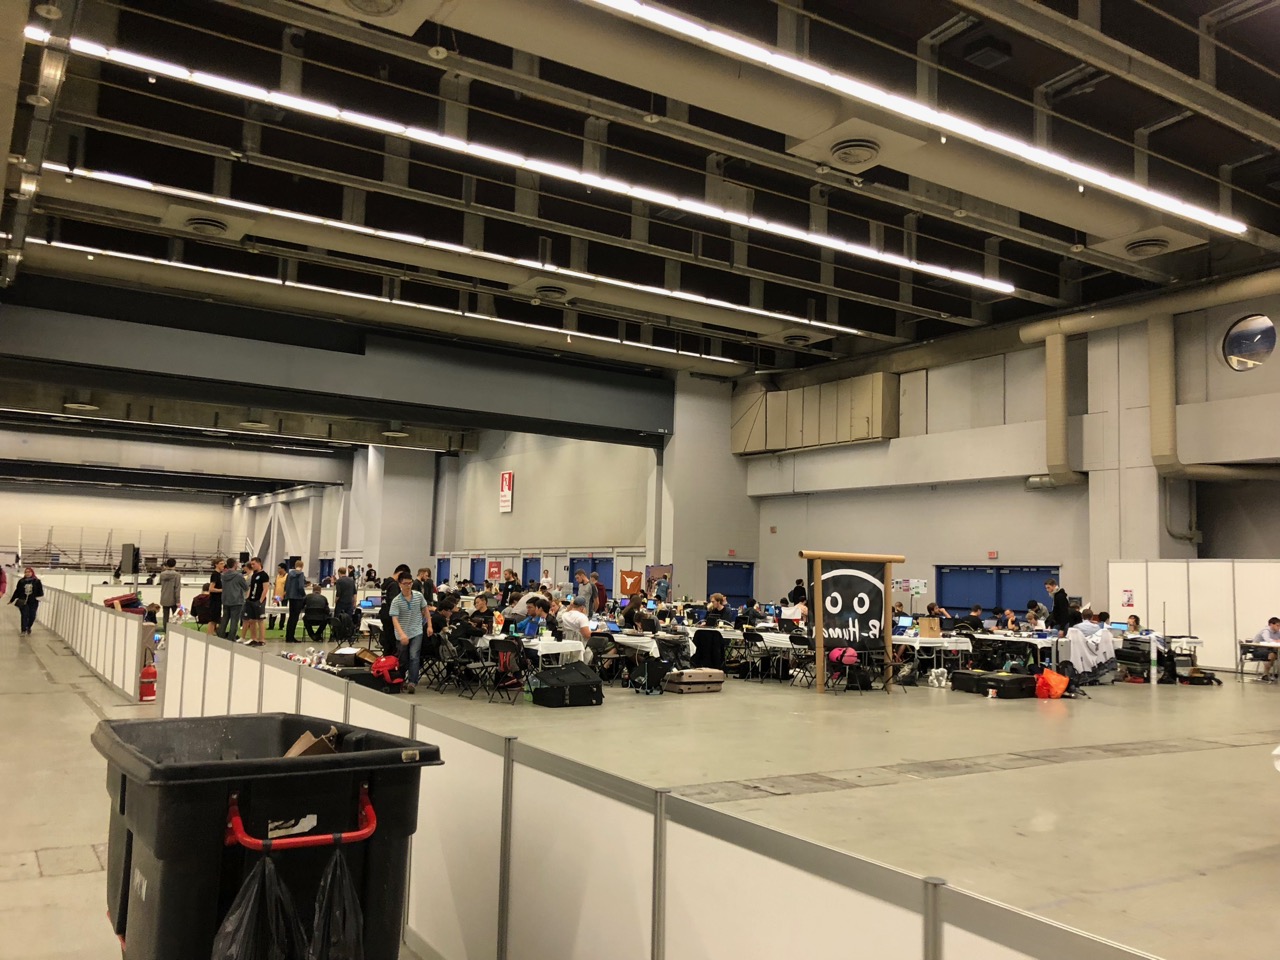
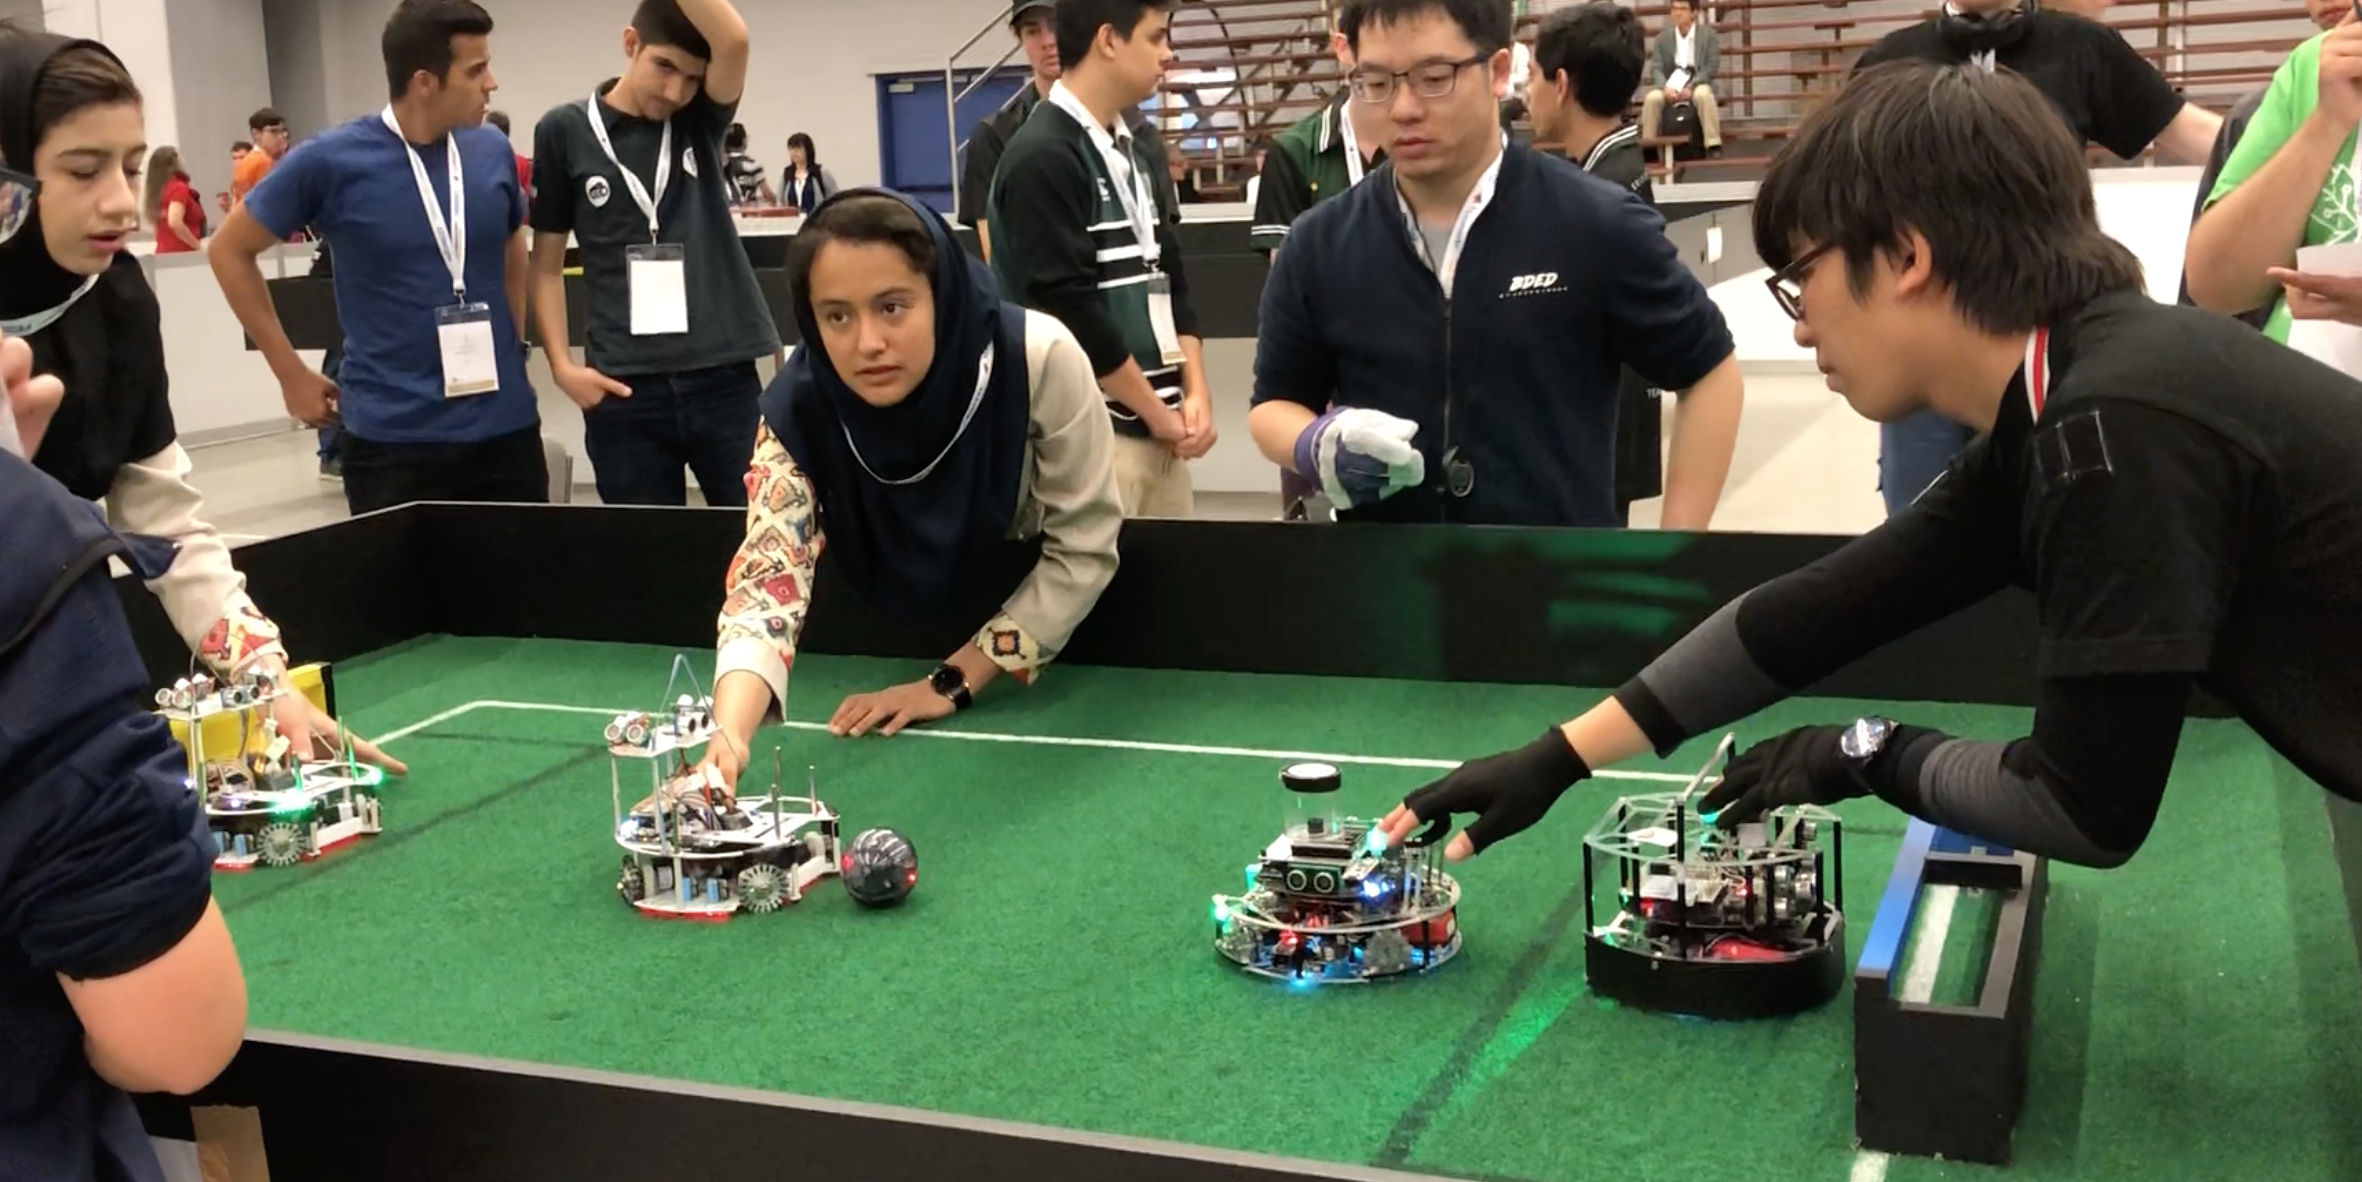
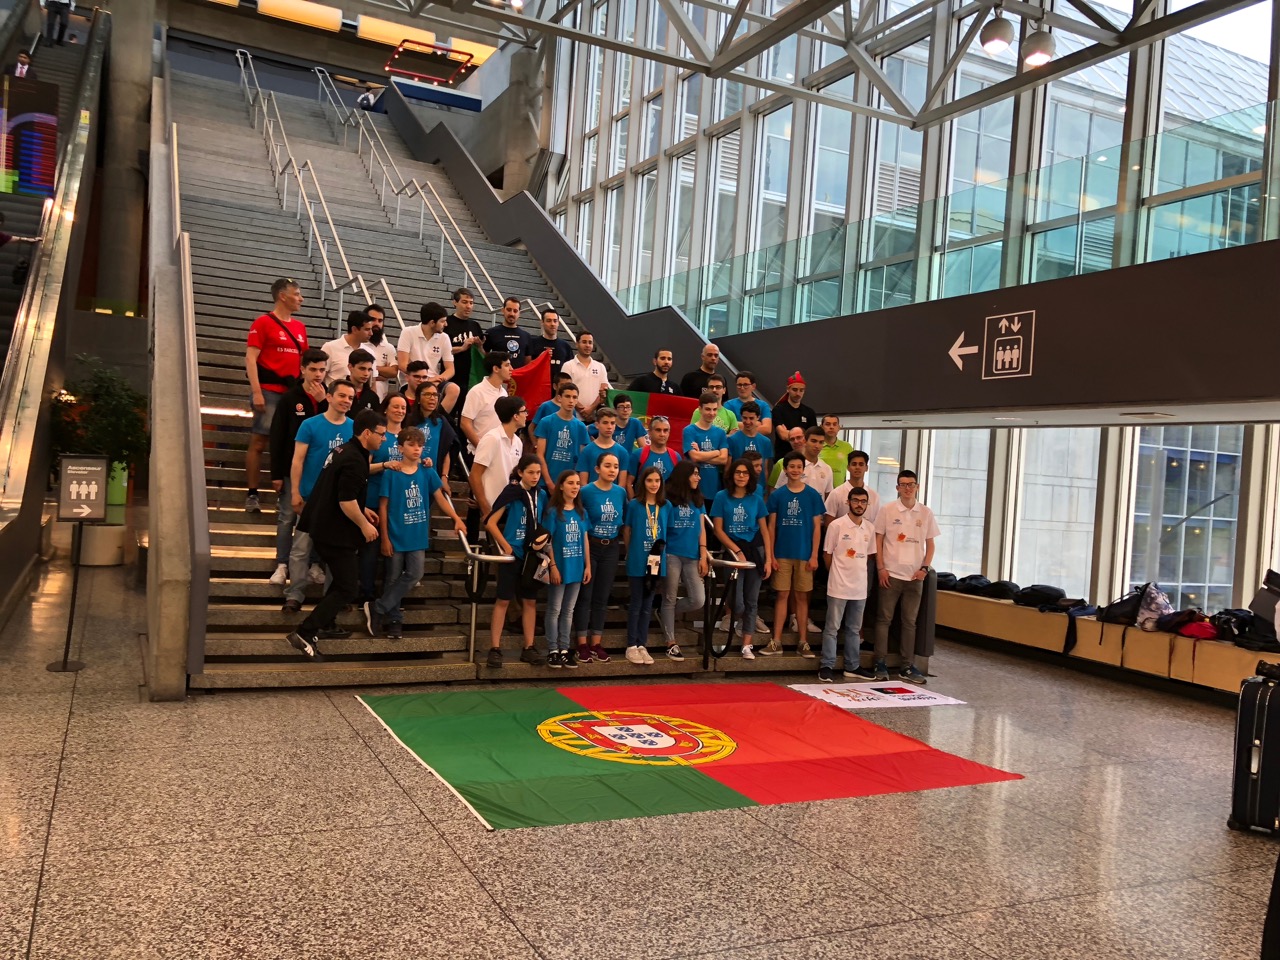
a huge difference in terms of resources and motivation from state sponsorship as was evident with the Iranian, Chinese, Russian, Singaporean, Croatian, Egyptian and Portuguese delegations.


A second learning was that at this level you need a stable platform and cannot afford to rebuild your bot for every run. Hopefully my son’s team is taking this feedback to heart and coming back to the competition stronger next year in Australia!

The kids had fun – here’s the team at the Notre-Dame Basilica of Montreal

How To Determine Which Machine Learning Technique Is Right For You?

Machine Learning is a vast field with various techniques available to a practitioner. This blog is about how to navigate this space and apply the right methods for your problem.

What is Machine Learning?

Tom Mitchel provides a very apt definition: “A computer program is said to learn from experience E with respect to some class of tasks T and performance measure P, if its performance at tasks in T, as measured by P, improves with experience E.”

E = the experience of playing many games.

T = the task of playing an individual game.

P = the probability that the program will win the next game.

For example a machine playing Go was able to beat the world’s best Go player. Earlier machines were dependent on humans to provide the example learning set. But in this instant, the machine was able to play against itself, and learn the basic Go techniques.

Broad classification of Machine Learning techniques are:

Supervised Learning: A set of problems where there is a relationship between input and output; Given a data set where we already know the correct output,  we can train a machine to derive this relationship and use this model to predict outcomes for previously unknown data points. These are broadly classified under “regression” and “classification” problems.

  • Regression: When we try to predict results within a continuous output meaning we try to map input variables to some continuous function.  For e.g. given the picture of a person, predicting the age of the person.
    1. Gradient Descent – or steepest descent is an optimization technique to follow the largest derivative to get to a local or global minima. This technique is often used in machine learning applications to calculate the coefficients in regression curve fitting over a training data set. Using these curve fitting coefficients, the program can then make  predictions on a continuous valued output for any new datasets presented to it.
    2. Normal Equation –  (\[\theta=(X^TX)^{-1}X^Ty\]) Refers to a set of simultaneous equations involving experimental unknowns and derived from a large number of observation equations using least squares adjustments.
    3. Neural Networks: Refers to a system of connected nodes that mimic our brains (biological neural networks). Such systems learn the model coefficients by observing real life data and once tuned can be used in output predictions for unseen data or observations outside the training set.  
  • Classification: When we try to predict results in a discrete output i.e. map input variables into discrete categories.  For e.g. given a patient with tumor, predicting whether its benign or malignant. Types of classification algorithms: 
    1. Large Margin Classification
    2. Kernels
    3. Support Vector Machines


Unsupervised Learning: When we derive the structure by clustering the data based on relationships among the variables in the data. With unsupervised learning there is no feedback based on the prediction results.


  • Clustering: Its the process of dividing a set of input data into possibly overlapping, subsets, where elements of each subset are considered related by some similarity measure. Take a collection of data, and find a way to automatically group this data that are similar or related by different variables. For e.g. the clustering of news on the google news home page.

Some classic graph clustering algorithms are the following:

  1. Kernel K-means : Select k data points from i/p as centroids, assign data points to nearest centroid; recompute centroid for each cluster till centroids do not change.
  2. K-spanning tree: Obtain the minimum spacing tree (MST) of an input graph; removing k-1 edges from the MST results in k clusters.
  3. Shared nearest neighbor: Obtain the shared nearest neighbor (SNN) graph the input graph; removing edges from the SNN with weight less than τ results in groups of non overlapping vertices. 
  4. Betweenness centrality based: quantifies the degree to which a vertex (or edge) occurs on the shortest path between all other pairs of nodes.  
  5. Highly connected components: the minimum set of edges whose removal disconnects a graph to produce a highly connected subgraph (HCS). 
  6.  Maximal clique enumeration : A subgraph C of graph G with edges between all pairs of nodes; Maximal clique is a clique not part of the larger clique; 


  • Non-Clustering: Allows you to find structure in a chaotic environment.
    1. Reinforced Learning: where software agents automatically determine ideal behavior to maximize performance.
    2. Recommender Systems: Is an information filtering system that seeks to predict the preference for an item from a user’s perspective by watching and learning the user’s behavior.
    3. Natural Language Processing: Is a field that deals with machine interaction with human languages. Specifically manages the following 3 challenges: speech recognition, understanding and response generation.


And finally, remember the 7 essential steps in accomplishing your machine learning project are the following:

  • Gathering the data
  • Preparing the data
  • Choosing a Model
  • Training your Model
  • Evaluating your Model parameters
  • Hyperparameter training
  • And finally prediction


Setting up a Technology Policy

A Technology Policy describes principles and practices that is used to manage risks within the technology organization in a company. The unconstraint growth of technology systems can introduce inherent risks that can threaten the business model of the firm.

I have had the opportunity to review and author Technology Policies at a number of organizations. The following are the key ingredients in a technology policy. Each of these policies should be accompanied by standards, procedures and controls that make these policies effective.

  • Security
    • Physical & Environmental Security Management: Covers physical access of a firm’s facilities, assets and physical technology from theft, loss, fraud or sabotage.
    • Network Security Management: Covers risk management of a firm’s network from theft, loss, fraud, sabotage or denial of service attacks.
    • Data Security Management: Covers the protection and management of data at rest as well as data in transit between systems internal and external to the firm. Role based access control is a common paradigm that is usually enforced to ensure that private or sensitive data is available only for the right roles and purposes.
    • Technology Risk Management: Covers the choice of technology components that a firm utilizes is in line and supportive of the business objectives and strategy as well as the laws and regulations under which a company operates.
    • Identity and Access Management: Managing access to the firm’s technology assets to prevent unauthorized access, disclosure, modification, theft or loss and fraud.
    • System & Infrastructure Security Management: Covers system/OS, software or other application patches to maintain integrity, performance and continuity of IT operations.
  • Development Practice Management
    • IT Architecture & Governance: Understanding short term and long term implications of technology initiatives/projects/architecture and product selection in alignment with business strategy.
    • System and Application Development and Maintenance Management: Covers application development and maintenance and inventory management of assets.
    • Change Implementation Management: Covers the planning, schedule, implementation and tracking of changes to production environments. Any change needs to be properly planned, scheduled, approved, implemented and verified to avoid disruption of business operations.
  • Data Management
    • Production Strategies: Manage through plans, processes, programs and practices the value and integrity of data produced during a firm’s operations.
    • Consumption Strategies: Manage through plans, processes, programs and practices the value and integrity of data consumed by a firm’s systems and clients and vendors.
  • Operations Risk Management
    • Service Level Management: Covers risk management around performance of firm systems, partner systems, operations and infrastructure performs within the specified service level agreements.
    • Incident & Problem Resolution Management: Management of risk around timely resolution of technology or operational incidents, communication of impact, elimination of root cause of the issues and mitigation of risk of reoccurrence.  Maintain a robust incident and problem management process to improve service delivery and reliability of operations.
    • Capacity Management: Covers risk management around managing availability, reliability, performance and integrity of systems towards maintaining customer, fiduciary and regulatory obligations by anticipating, planning, measuring and managing capacity during regular and peak business operations.
    • Business Continuity & Disaster Recovery Management: Covers management of risks around business continuity in events of disaster whether environmental, physical, political, social or other unanticipated causes. Disaster Recovery process detailing prevention, containment and recovery functions on a timely basis to recover business operations, protect critical infrastructure and assets is a critical part of this policy.
    • Vendor Management: Manage third party vendor operations and support activities in support of regulatory or other supervisory obligations as well as ensuring a good value for money from this technology or operations expenditure.
  • Policy Assurance Management: Manages the specification and adherence to the above policies by the technology, business and operations organizations.