Healthcare Value Chain Innovation? An alternative model

What is ailing the healthcare market? Why do we(Americans) pay higher per capita for treating a disease condition? Is it just because we have access to the most innovative solutions? Do we have misaligned incentives? Is all the work that is done in the healthcare value chain value added work? Or are we classifying busy work as value add when all it’s doing is to sustain an over complicated system that existing players have an incentive to maintain.
Let’s talk about what ails healthcare. Why is it fundamentally a different kind of product? Why do the normal rules of market competition and capitalism not apply here?
  1. When someone needs acute treatment, the consumer usually does not have the time to shop around. For e.g. when a patient is in an ambulance for being treated for a heart attack – its not the time he/she checks the scores for the nearby hospitals about how cost effective they are or whether they provide value for money.
  2. It appears to be a zero sum competition – In which gains of one system participant come at the expense of others. This kind of competition does not create value for patients, but erodes quality, limits access, fosters inefficiency, creates excess capacity, drives up administrative costs among other nefarious effects. Why can providers of diabetes meters and wheel chairs advertise to the Medicare eligible patient community offering free stuff at Medicare’s expense. Why does CMS not have the ability to negotiate rates for common services given the volume it commands?
  3. Who is the consumer and who is actually making the decision on consumption? Healthcare products are not ordered by end consumers – Orders by workers on the frontline of healthcare delivery such as physicians, nurses and so on. Purchasing is thus not an organizational competence, let alone a core competence but rather the domain of non-business people.
  4. The provider industry is largely based on non profit ownership – No real emphasis on budgeting, process improvement or IT optimization. Also since a large portion of provider revenues flow from federal and state governments, some believe that providers have developed a welfare mentality rather than strong profit and loss mindset.
  5. Fragmented Industry – Despite consolidation, it is still a fragmented industry with no real leadership at any stage. Fragmentation complicates the task of connecting thousands of parties involved at each stage in the chain, and standardizing the format and content of their business transactions.
  6. Providers made investments in patient care rather than technology –  Procurement and other functions are based in dated legacy systems with little direct connectivity with manufacturers. Product master catalogs are often paper based, and their contents (product descriptions, prices) typically differ across players in the chain due to time lags in relaying and uploading new product and contract information.
  7. Treating the value chain as a supply chain and the focus of manufacturers on creating demand for a product using a push model rather than a pull model.
  8. Lack of transparency through negotiated contracts, pricing agreements and no easy way for a patient to tell what a healthcare product should actually cost.
Let’s imagine alternate models – one based on capitalism and competition (but unfettered and unconstrained). Another socialist but efficient universal healthcare.
To choose we must define what our core principles are as a society – do we consider healthcare a “right” or a “privilege”.
If it’s a privilege then why do we insist on the Hippocratic Oath – why can’t emergency rooms turn away dying patients unless they can pay upfront?
If it’s a right, then why should we not use the most efficient way delivering and  paying for healthcare? From a payment perspective, having a single payer for basic services is probably the most efficient, given the benefits of scale.
A combination of the two may be best suited for us – where basic healthcare and pursuit of the Hippocratic oath may be a base guarantee by the government (basic healthcare as a right), while add ons are optional and at the patient’s discretion for which they can choose to procure insurance – for e.g.  the type of room or facility you check into when being admitted for a procedure. Or the choice of a certain brand of a product that may be above and beyond what basic coverage is available for free.
Also allow for vertical integration across the value chain and let larger end to end entities compete. Remove the incentive of manufacturers to push product, instead they become a part of competing value chains they may compete in treatment levels that are simple, standard or complex.
In addition, the following steps should help make our healthcare delivery systems effective, efficient and outcome based for the patient.
  1. Establish the right (and mutually agreed upon) objectives for each player in the market.
  2. Simplify the market, regulations and system to only allow value added activities rather than the labyrinth of activities in current state for e.g. managing rebates, claw backs, pay backs as a way of keeping incentives for all players in line.
  3. Build transparency and an easy objective way of comparing value.
  4. Move from a manufacturing supply chain to a value chain way of operating.
  5. Analyze 3 critical flows – product, money and information for driving towards efficiency.
  6. Set up profit incentives for all players to become efficient and effective in their operations.
This is an extremely complicated topic and two of the books that have greatly influenced my thinking are Redefining Healthcare by Michael Porter and Elizabeth Teisberg and Healthcare Value Chains: Producers, Purchasers and Providers by Lawton R Burns at Wharton in addition to my own experience navigating this space in various roles at a PBM.
There may not be a silver bullet, but through debate, discussion and action we could move our healthcare system to a place where it delivers for its main beneficiary – “The Patient”.
Happy to receive feedback and look forward to a meaningful dialog…

Context Is Important

Knowing your Business Context is key to Product Development.

What is business Context?

Business context is the sum total of conditions that exist in the market – the availability/lack of capital, the demand (customer), supply (competition), your own capabilities (people, process, systems & technology), availability of patents, trade secrets or trade marks, brand access, product lifecycle, supply chain for how your product is assembled, sales, marketing & distribution channels, and other external forces like regulations, government policy.

It allows for you to be able to reconfigure your capabilities to affect business model innovation. A simple context diagram like the following goes a long way towards helping you gain consensus among practitioners, stakeholders and customers.
An organization has its own culture. Understanding power structures and organizational context is critical to being able to innovate. You will need budget, capabilities, resources, and buyin to get anything done. Navigating the corporate labyrinth can only be achieved through selling your ideas.
The following is an example of how we changed the game by introducing a product like Therapeutic Resource Centers into a standard utility business like a PBM.
We have created a proprietary framework to help sell your ideas.  Here is an example of the framework which I have used in the past to validate our strategy.

Update from RoboCup 2018 – Montreal CA

My son’s team had qualified for the rescue line competition at the international RoboCup 2018 competition in Montreal Canada. While his team did not do as well (26 out of 38 teams) – it was a great learning experience. Since it was our first international competition, we were also awed by the level of the competition as well as the advanced robotics capabilities on display.

Here’s a description of some of the advances we saw at the conference.

Tickets:

We got tickets early in the morning on Sunday June 17th, and the rest of the day went in team setup, practice runs and calibration & tuning the robotics programs.

Setup:

Sunday, June 17 was for setup at the Palais De Congres in Montreal.

Rescue Line Competition:

The competition primarily consisted of teams building their own bots to navigate a variety of challenges like line tracing, navigating left, right and U turns, navigating road bumps, debris and obstacles, tackling ramps, bridges etc. In addition being able to score points in the rescue room by identifying victims and carrying them to the respective rescue zones. All of this was to be available as capabilities of the bot and to use sensors to autonomously navigate through the obstacle course and accomplish the above mentioned tasks.

Rescue Line Winning Team – Iranian Kawash. The following is a video of their winning robot in the rescue zone.

Sid’s Team run –
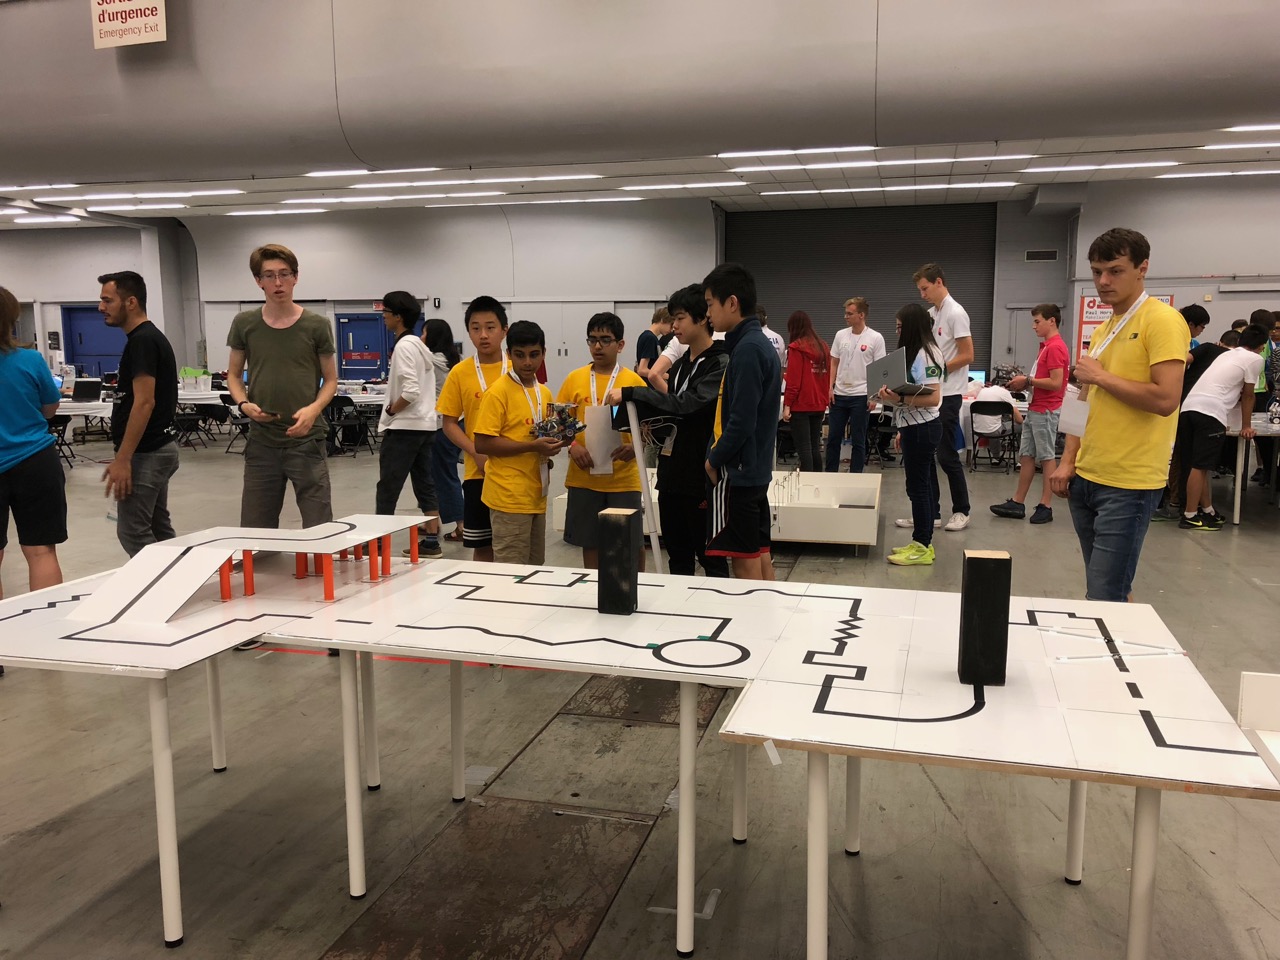
Winning Robot: Team Kavosh from Iran

Rescue Maze Competition:

The objective of the rescue maze competition is for a robot to navigate a complex maze and identify victims to save.

Team Soccer:

Autonomous bots in a team playing soccer. The soccer tournament came a various levels –
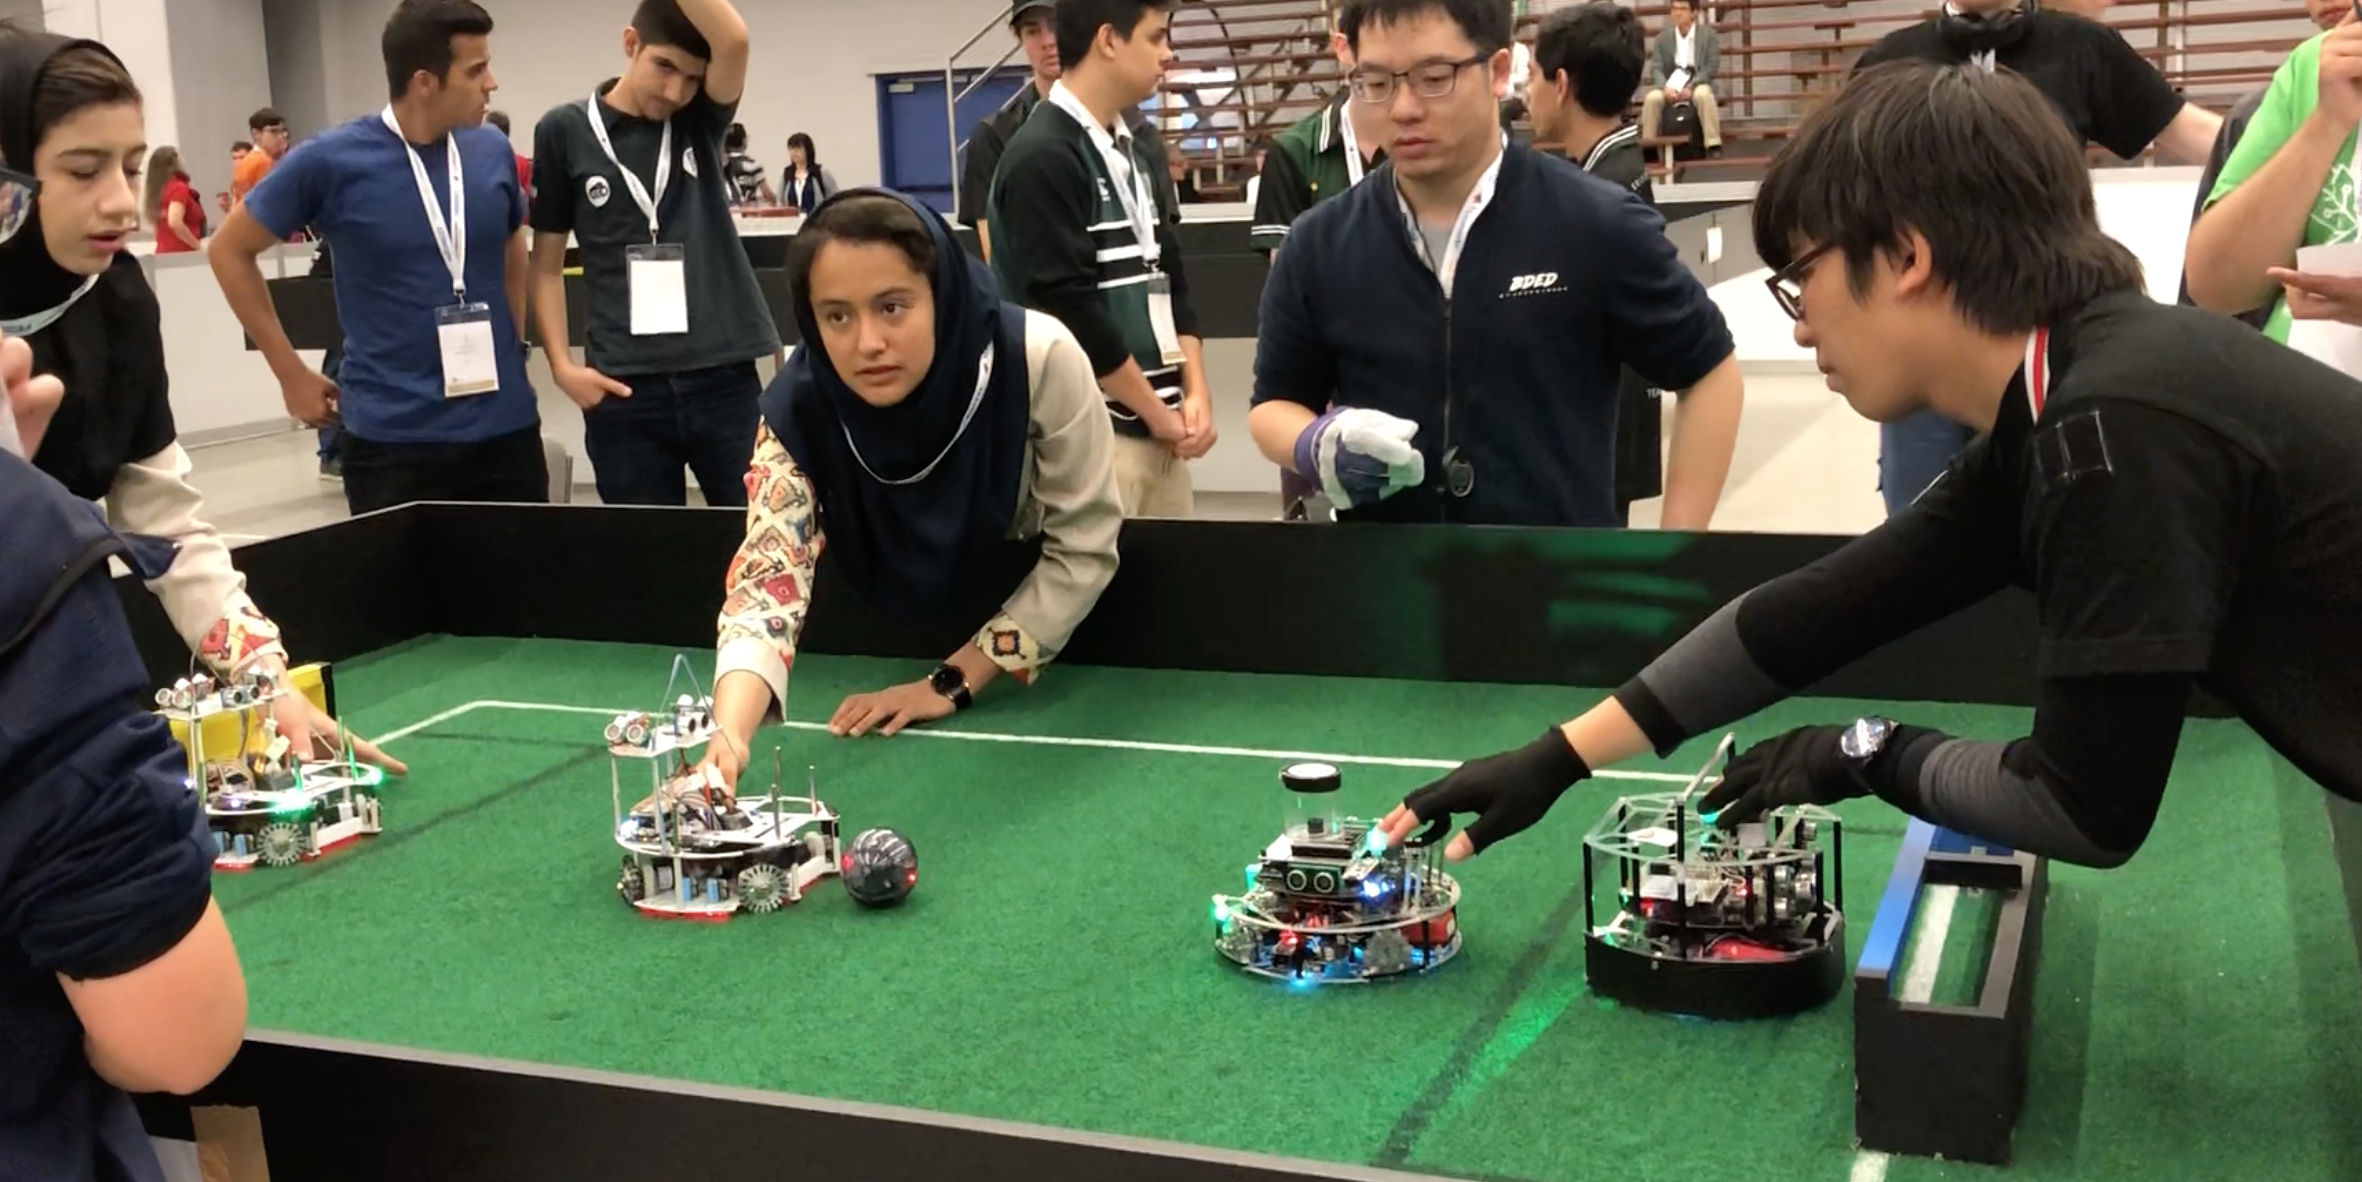
Middle Size League:

Powerful bots playing soccer with a full size soccer ball. Here’s a video of a goal from one of the teams.
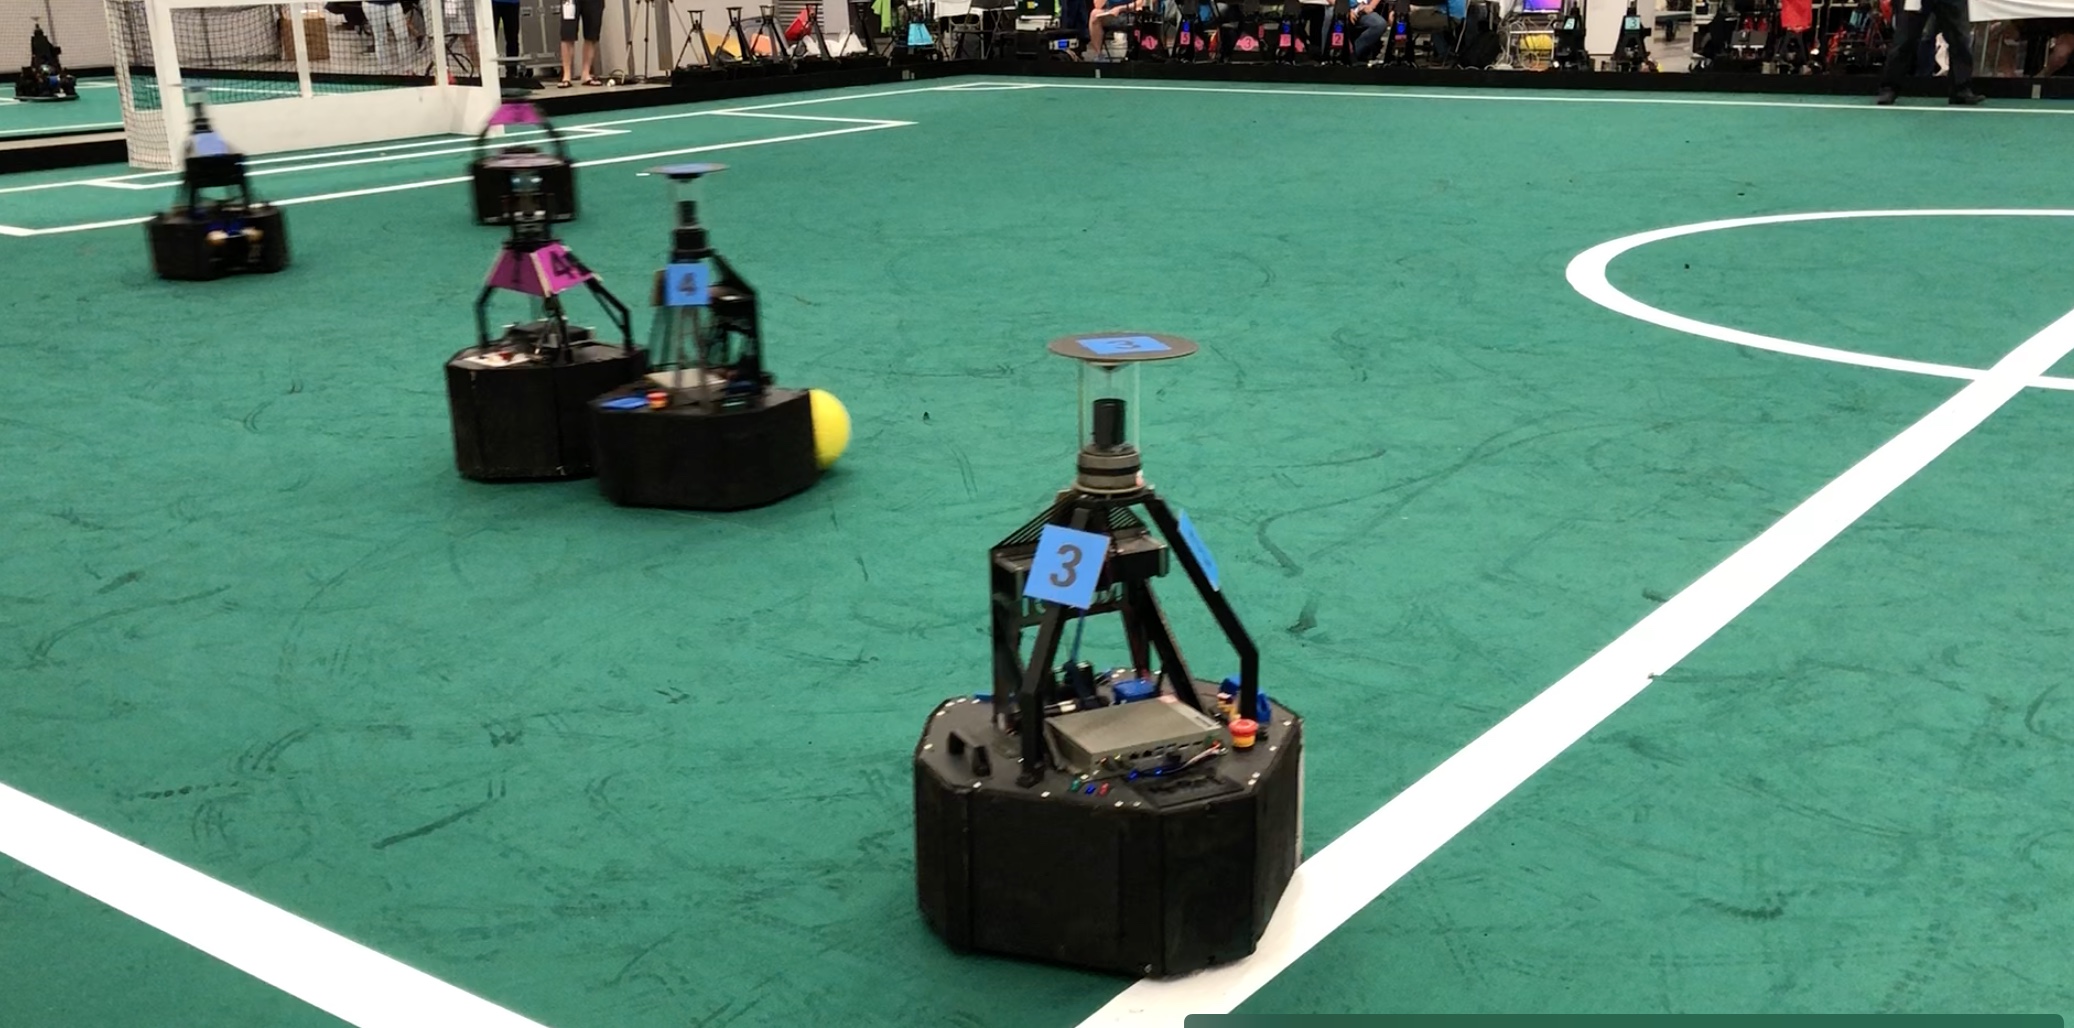
Junior League:

A very fast paced soccer game with bots acting in coordination as one team against an opposing team. Here’s a video that shows how exciting this can be.

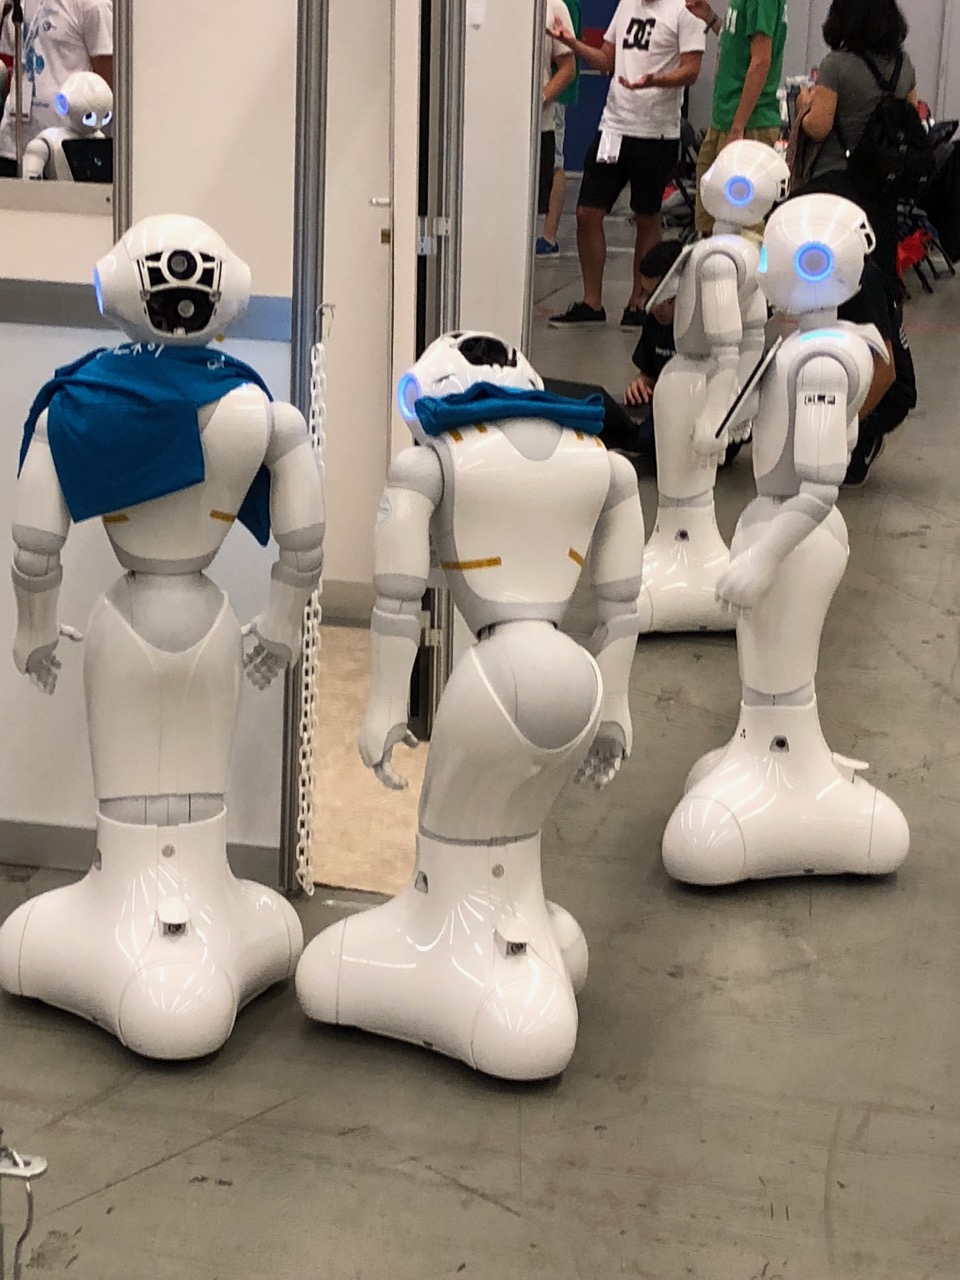
Humanoid Robot Soccer:

There were three categories – Kidsize Humanoid League, Humanoid League

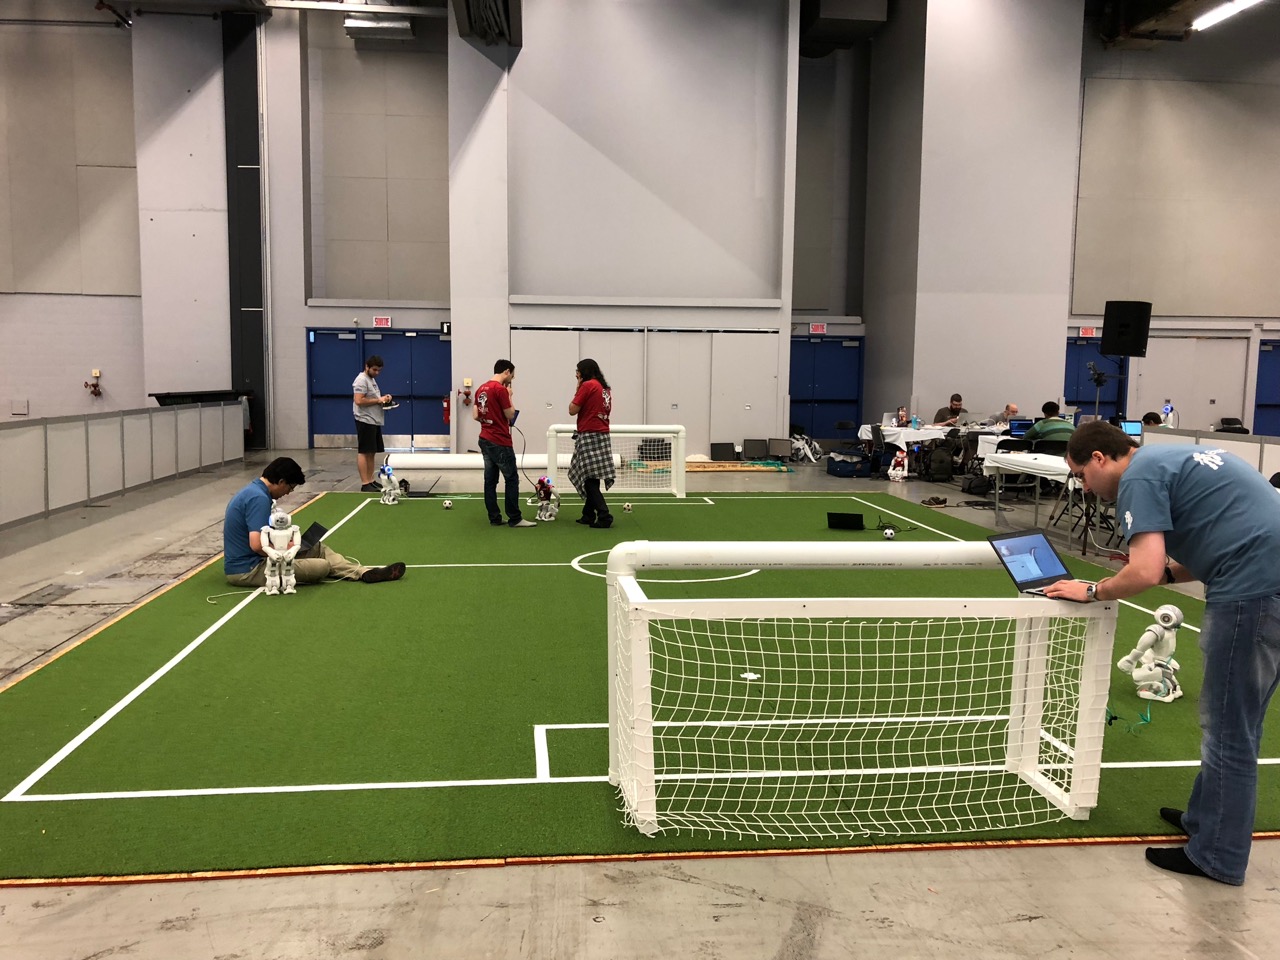
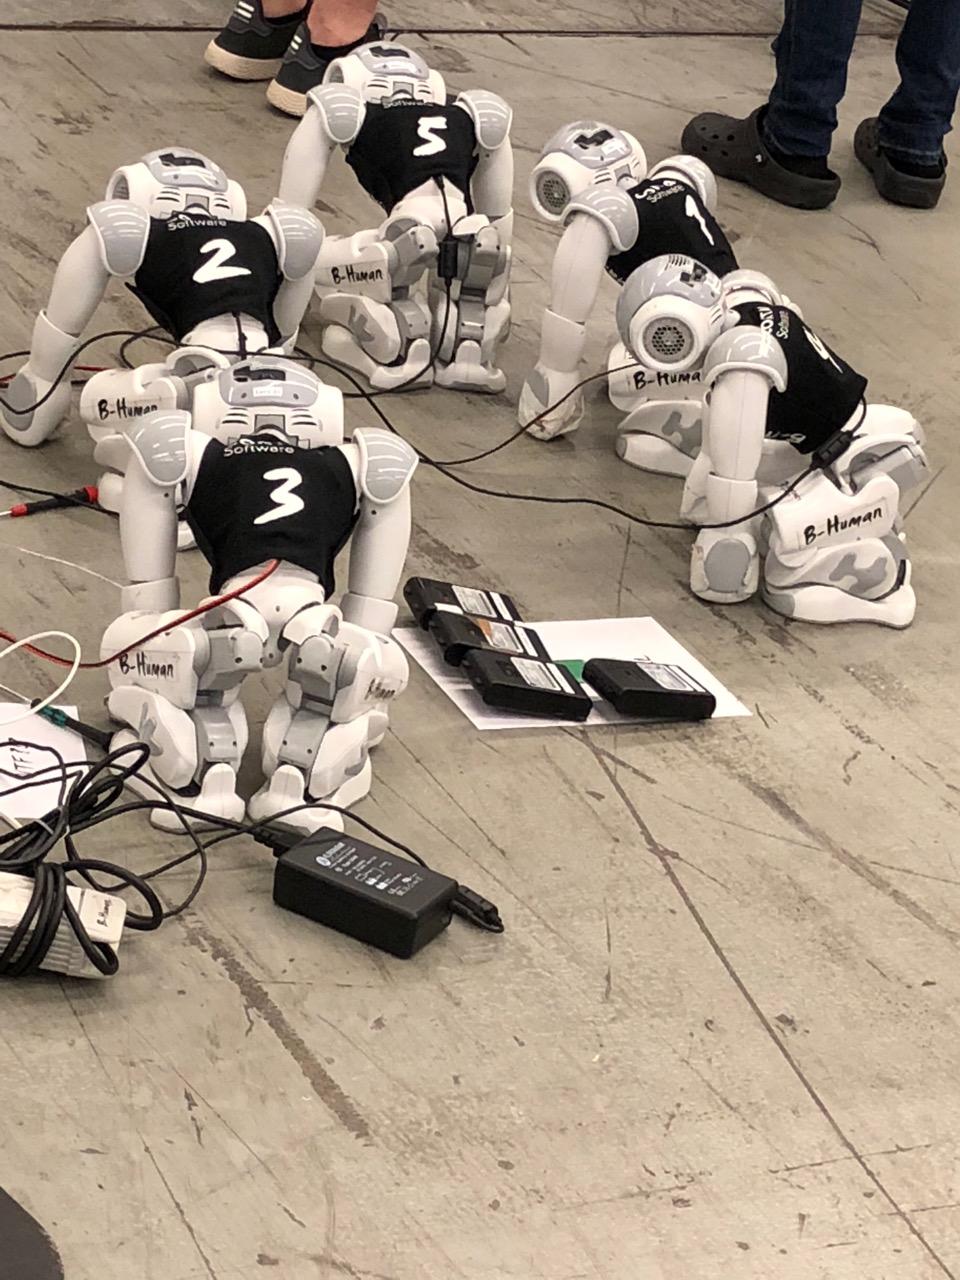
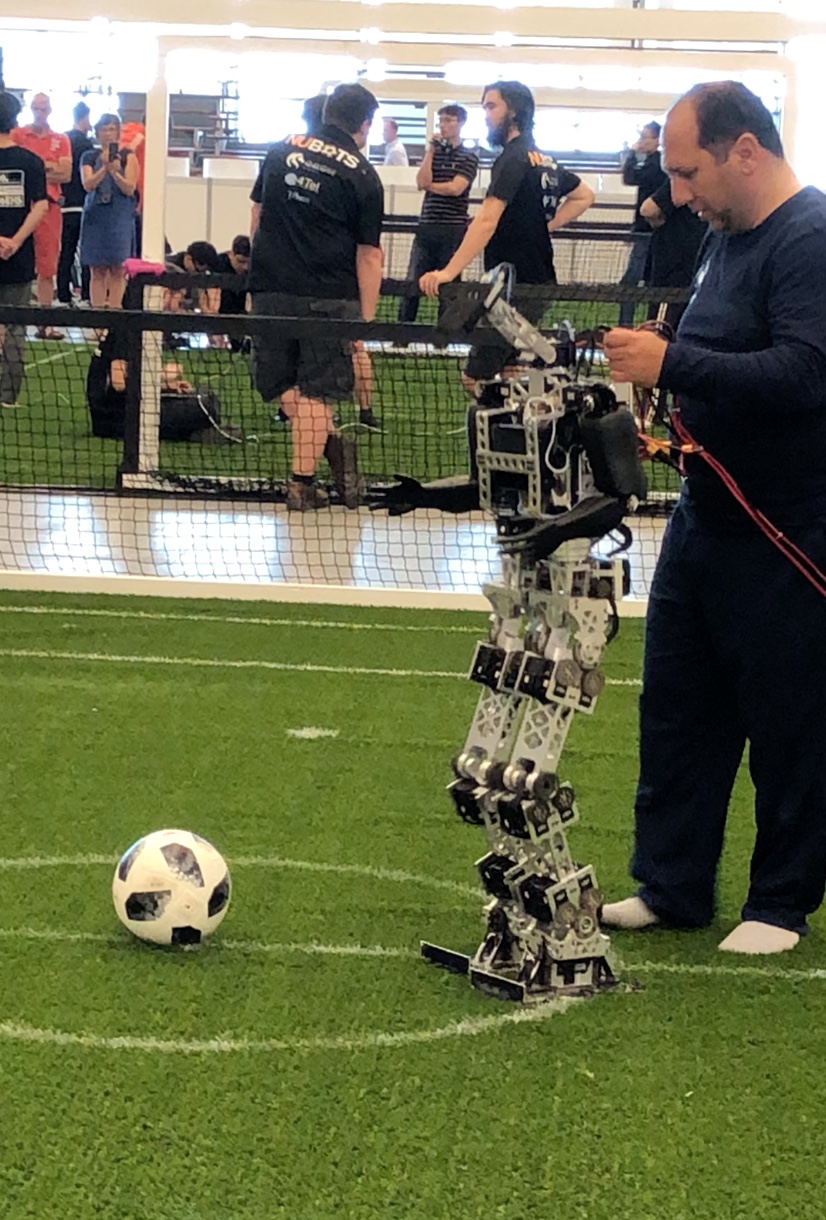
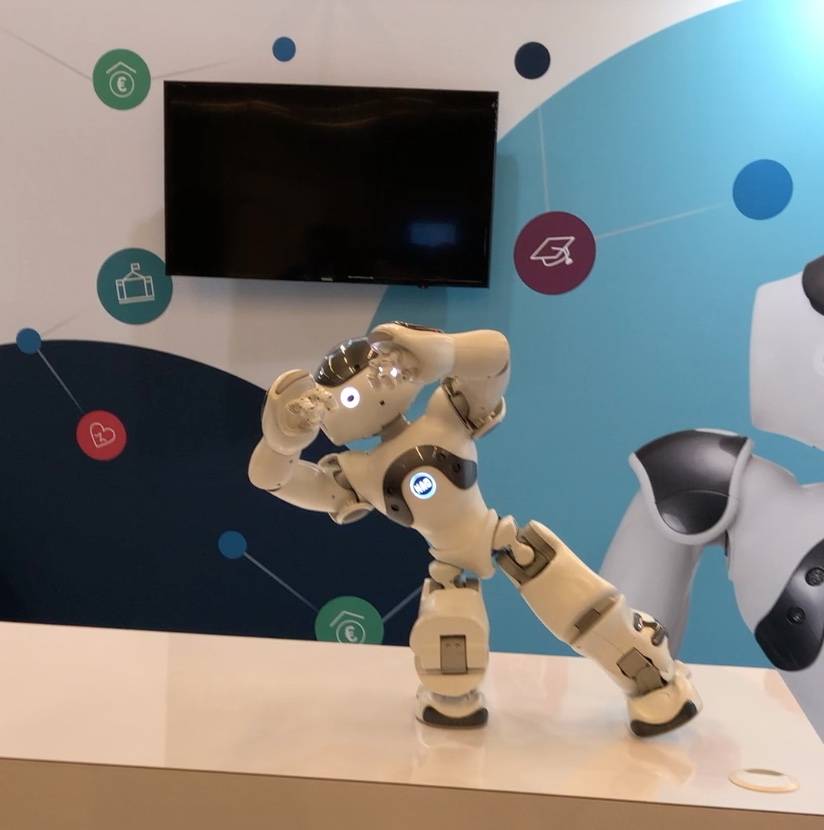
and Standard Platform League. There were mainly two challenges – building a humanoid robot to navigate locomotion challenges of walking while controlling and navigating a ball towards the opponents goal. The Standard Platform (for e.g. using Softbank’s NAO Generation 4) to play as a team the full soccer match. These looked like toddlers who were navigating the challenges of walking, coordinating, sensing and controlling the ball and  shooting goals. Overall it was great fun to watch! Do check out the videos below.


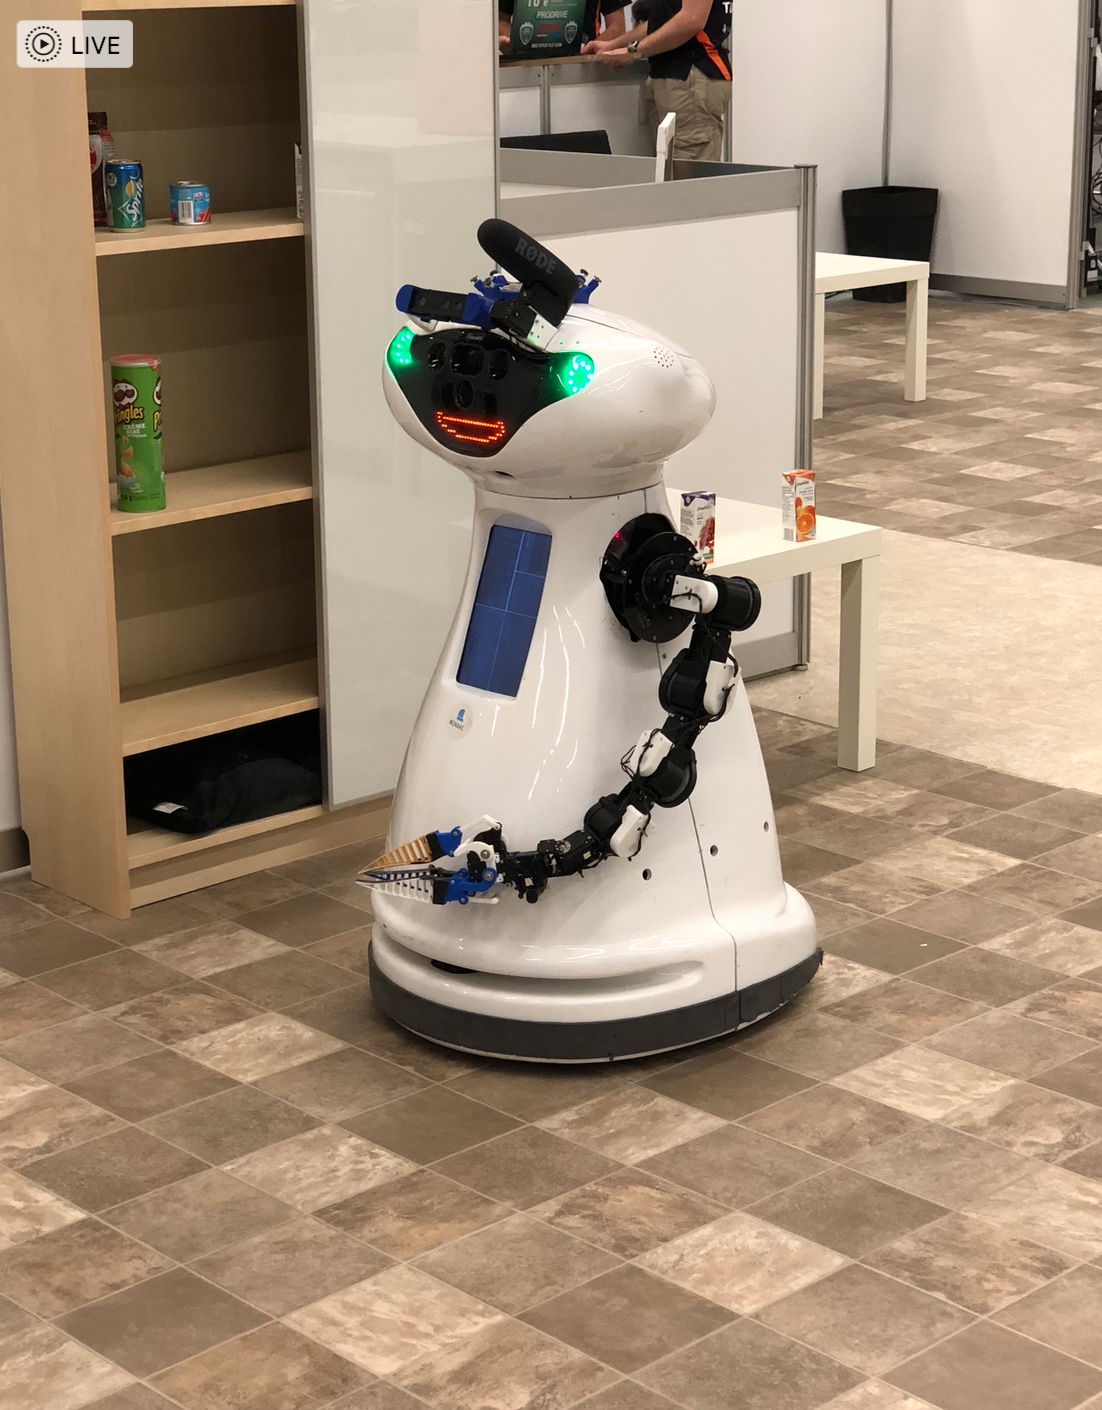
Industrial Robots and Others at Work and Home settings:

We saw a number of demonstrations from a number of different companies on industrial robotics. A few are described in the following videos.
There were a number of other home setting challenges as well – for example unloading grocery bags and storing them in the right location/shelf in a home.
Rescue Robot League:

Navigating difficult terrain robots: These are primarily demonstrations of how bots can be used in a hazardous situation for rescue. Challenges included navigating difficult terrains, opening doors, accomplishing tasks such as sensor readings, mapping a maze or path through the field etc. Some videos listed here are very impressive. These teams were mainly university and research lab teams. Do check out the following links.
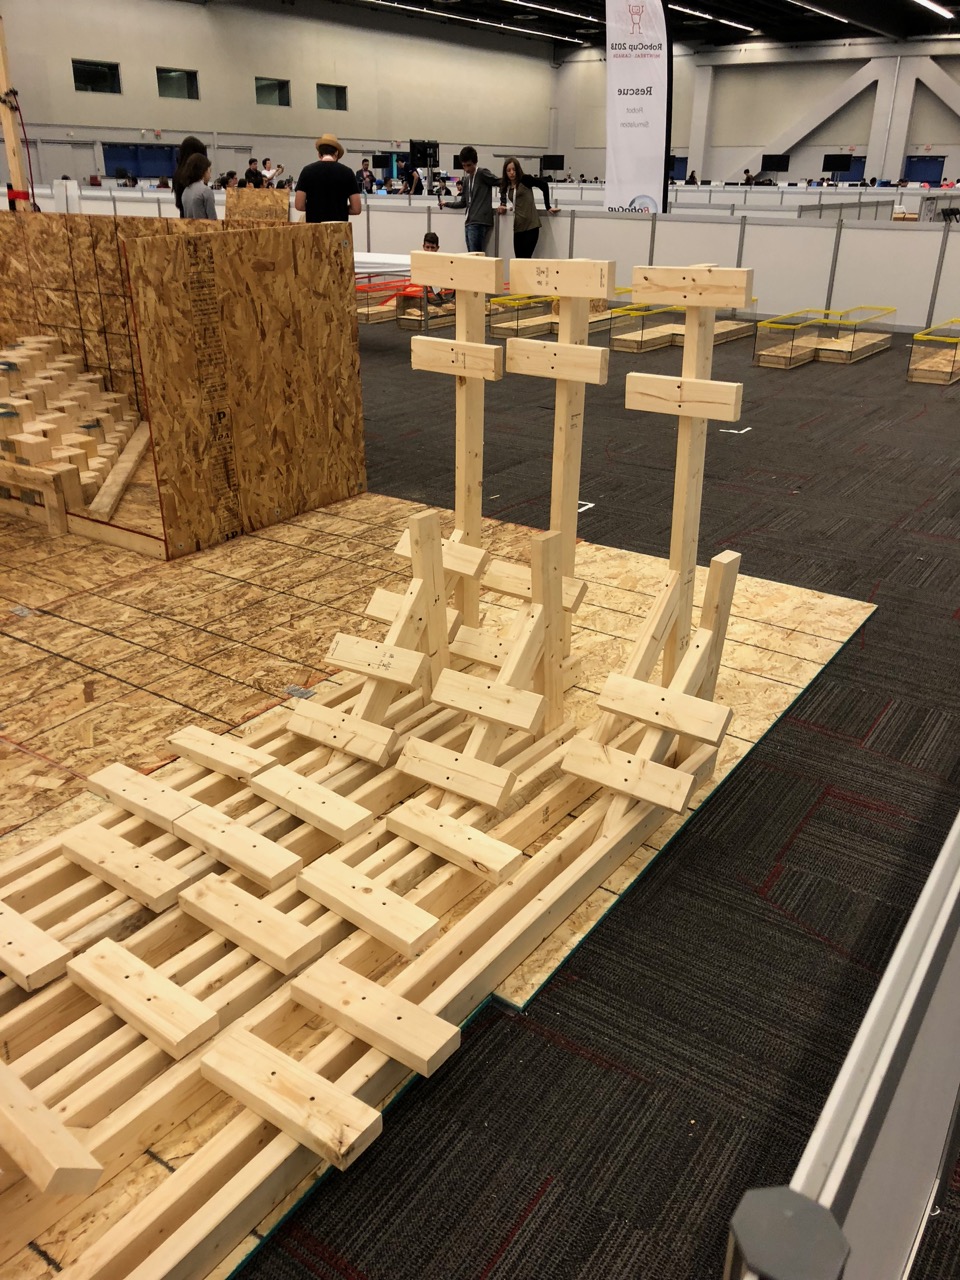
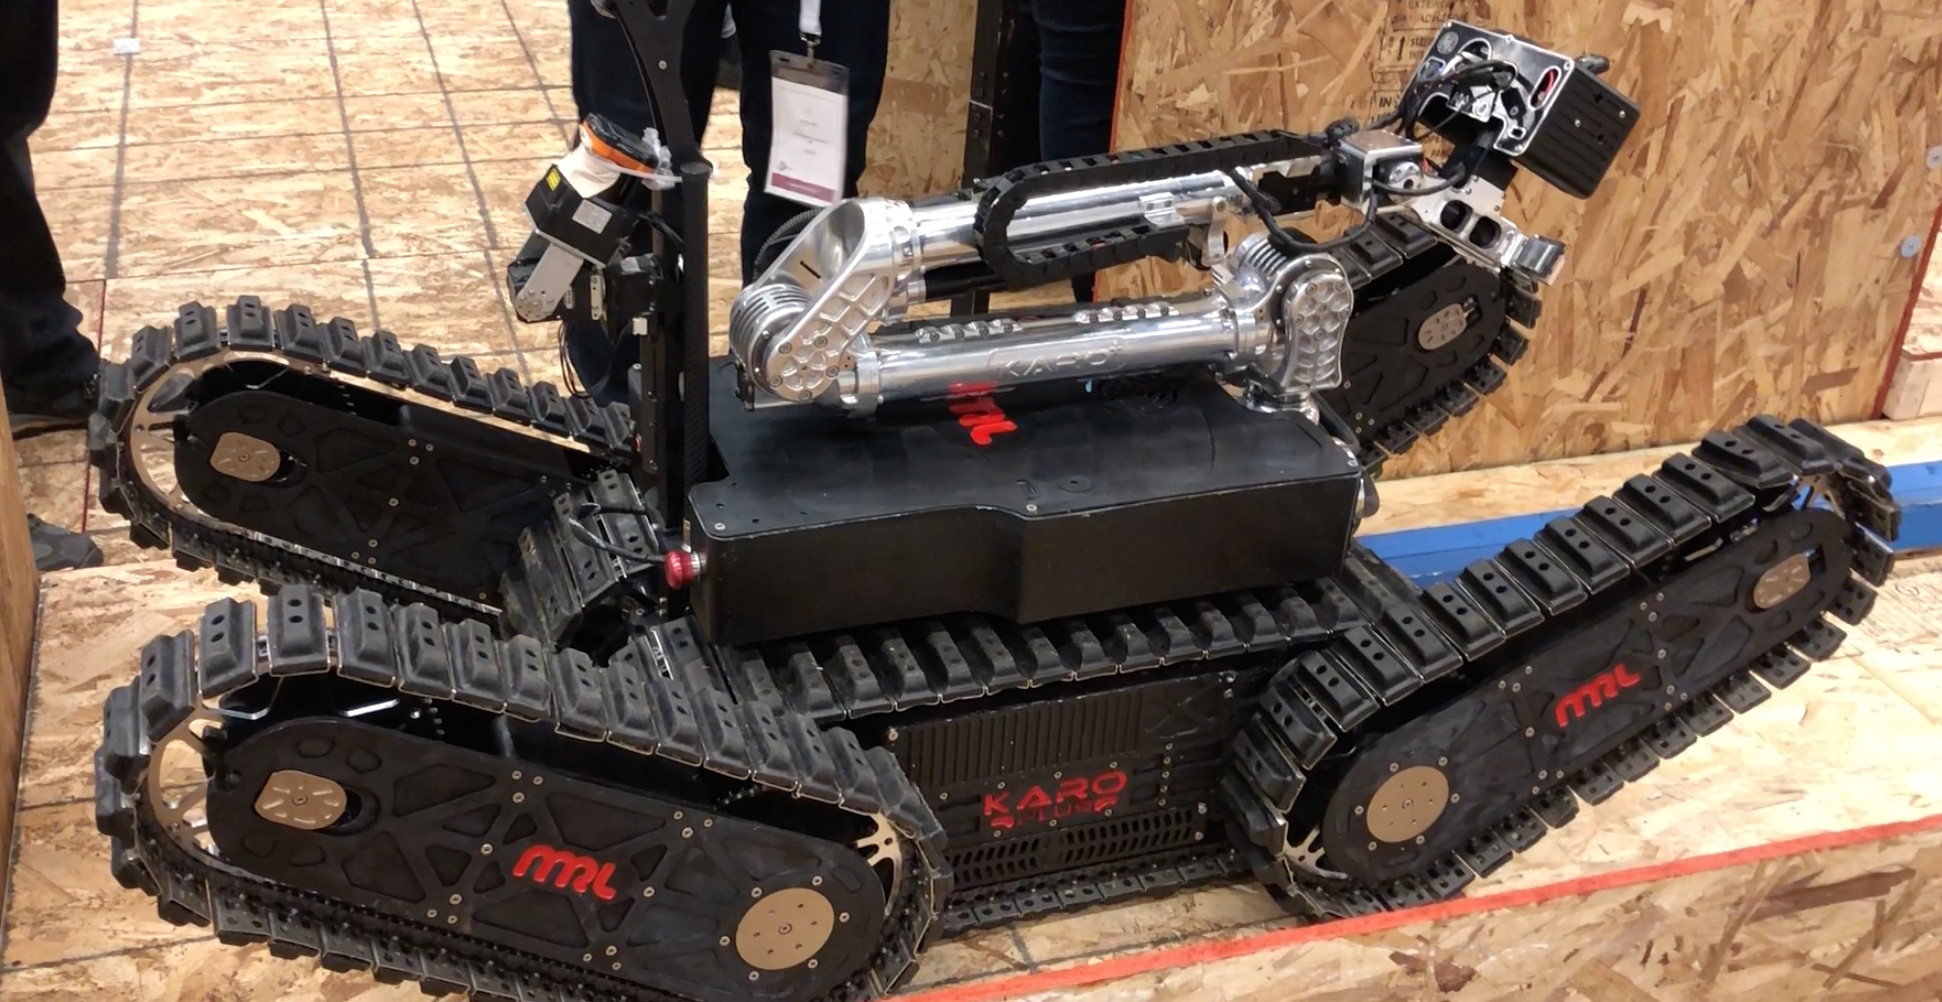


Sponsors:

Softbank was a big sponsor at the event.

It has made huge investments into robotics. It will be evident from the following videos that making these investments is critical to succeeding in the near future when we expect a lot of the mundane work to be automated and mechanized.
 

Closing thoughts:

We saw that we were competing against a number of national teams. There is a huge difference in terms of resources and motivation from state sponsorship as was evident with the Iranian, Chinese, Russian, Singaporean, Croatian, Egyptian and Portuguese delegations.


A second learning was that at this level you need a stable platform and cannot afford to rebuild your bot for every run. Hopefully my son’s team is taking this feedback to heart and coming back to the competition stronger next year in Australia!

The kids had fun – here’s the team at the Notre-Dame Basilica of Montreal

How To Determine Which Machine Learning Technique Is Right For You?

Machine Learning is a vast field with various techniques available to a practitioner. This blog is about how to navigate this space and apply the right methods for your problem.

What is Machine Learning?

Tom Mitchel provides a very apt definition: “A computer program is said to learn from experience E with respect to some class of tasks T and performance measure P, if its performance at tasks in T, as measured by P, improves with experience E.”

E = the experience of playing many games.

T = the task of playing an individual game.

P = the probability that the program will win the next game.

For example a machine playing Go was able to beat the world’s best Go player. Earlier machines were dependent on humans to provide the example learning set. But in this instant, the machine was able to play against itself, and learn the basic Go techniques.

Broad classification of Machine Learning techniques are:

Supervised Learning: A set of problems where there is a relationship between input and output; Given a data set where we already know the correct output,  we can train a machine to derive this relationship and use this model to predict outcomes for previously unknown data points. These are broadly classified under “regression” and “classification” problems.

  • Regression: When we try to predict results within a continuous output meaning we try to map input variables to some continuous function.  For e.g. given the picture of a person, predicting the age of the person.
    1. Gradient Descent – or steepest descent is an optimization technique to follow the largest derivative to get to a local or global minima. This technique is often used in machine learning applications to calculate the coefficients in regression curve fitting over a training data set. Using these curve fitting coefficients, the program can then make  predictions on a continuous valued output for any new datasets presented to it.
    2. Normal Equation –  (\[\theta=(X^TX)^{-1}X^Ty\]) Refers to a set of simultaneous equations involving experimental unknowns and derived from a large number of observation equations using least squares adjustments.

    3. Neural Networks: Refers to a system of connected nodes that mimic our brains (biological neural networks). Such systems learn the model coefficients by observing real life data and once tuned can be used in output predictions for unseen data or observations outside the training set.  
  • Classification: When we try to predict results in a discrete output i.e. map input variables into discrete categories.  For e.g. given a patient with tumor, predicting whether its benign or malignant. Types of classification algorithms: 
    1. Large Margin Classification
    2. Kernels
    3. Support Vector Machines


Unsupervised Learning: When we derive the structure by clustering the data based on relationships among the variables in the data. With unsupervised learning there is no feedback based on the prediction results.


  • Clustering: Its the process of dividing a set of input data into possibly overlapping, subsets, where elements of each subset are considered related by some similarity measure. Take a collection of data, and find a way to automatically group this data that are similar or related by different variables. For e.g. the clustering of news on the google news home page.

Some classic graph clustering algorithms are the following:

  1. Kernel K-means : Select k data points from i/p as centroids, assign data points to nearest centroid; recompute centroid for each cluster till centroids do not change.
  2. K-spanning tree: Obtain the minimum spacing tree (MST) of an input graph; removing k-1 edges from the MST results in k clusters.
  3. Shared nearest neighbor: Obtain the shared nearest neighbor (SNN) graph the input graph; removing edges from the SNN with weight less than τ results in groups of non overlapping vertices. 
  4. Betweenness centrality based: quantifies the degree to which a vertex (or edge) occurs on the shortest path between all other pairs of nodes.  
  5. Highly connected components: the minimum set of edges whose removal disconnects a graph to produce a highly connected subgraph (HCS). 
  6.  Maximal clique enumeration : A subgraph C of graph G with edges between all pairs of nodes; Maximal clique is a clique not part of the larger clique; 


  • Non-Clustering: Allows you to find structure in a chaotic environment.
    1. Reinforced Learning: where software agents automatically determine ideal behavior to maximize performance.
    2. Recommender Systems: Is an information filtering system that seeks to predict the preference for an item from a user’s perspective by watching and learning the user’s behavior.
    3. Natural Language Processing: Is a field that deals with machine interaction with human languages. Specifically manages the following 3 challenges: speech recognition, understanding and response generation.


And finally, remember the 7 essential steps in accomplishing your machine learning project are the following:

  • Gathering the data
  • Preparing the data
  • Choosing a Model
  • Training your Model
  • Evaluating your Model parameters
  • Hyperparameter training
  • And finally prediction


Setting up a Technology Policy

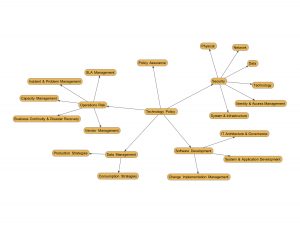
A Technology Policy describes principles and practices that is used to manage risks within the technology organization in a company. The unconstraint growth of technology systems can introduce inherent risks that can threaten the business model of the firm.

I have had the opportunity to review and author Technology Policies at a number of organizations. The following are the key ingredients in a technology policy. Each of these policies should be accompanied by standards, procedures and controls that make these policies effective.

  • Security
    • Physical & Environmental Security Management: Covers physical access of a firm’s facilities, assets and physical technology from theft, loss, fraud or sabotage.
    • Network Security Management: Covers risk management of a firm’s network from theft, loss, fraud, sabotage or denial of service attacks.
    • Data Security Management: Covers the protection and management of data at rest as well as data in transit between systems internal and external to the firm. Role based access control is a common paradigm that is usually enforced to ensure that private or sensitive data is available only for the right roles and purposes.
    • Technology Risk Management: Covers the choice of technology components that a firm utilizes is in line and supportive of the business objectives and strategy as well as the laws and regulations under which a company operates.
    • Identity and Access Management: Managing access to the firm’s technology assets to prevent unauthorized access, disclosure, modification, theft or loss and fraud.
    • System & Infrastructure Security Management: Covers system/OS, software or other application patches to maintain integrity, performance and continuity of IT operations.
  • Development Practice Management
    • IT Architecture & Governance: Understanding short term and long term implications of technology initiatives/projects/architecture and product selection in alignment with business strategy.
    • System and Application Development and Maintenance Management: Covers application development and maintenance and inventory management of assets.
    • Change Implementation Management: Covers the planning, schedule, implementation and tracking of changes to production environments. Any change needs to be properly planned, scheduled, approved, implemented and verified to avoid disruption of business operations.
  • Data Management
    • Production Strategies: Manage through plans, processes, programs and practices the value and integrity of data produced during a firm’s operations.
    • Consumption Strategies: Manage through plans, processes, programs and practices the value and integrity of data consumed by a firm’s systems and clients and vendors.
  • Operations Risk Management
    • Service Level Management: Covers risk management around performance of firm systems, partner systems, operations and infrastructure performs within the specified service level agreements.
    • Incident & Problem Resolution Management: Management of risk around timely resolution of technology or operational incidents, communication of impact, elimination of root cause of the issues and mitigation of risk of reoccurrence.  Maintain a robust incident and problem management process to improve service delivery and reliability of operations.
    • Capacity Management: Covers risk management around managing availability, reliability, performance and integrity of systems towards maintaining customer, fiduciary and regulatory obligations by anticipating, planning, measuring and managing capacity during regular and peak business operations.
    • Business Continuity & Disaster Recovery Management: Covers management of risks around business continuity in events of disaster whether environmental, physical, political, social or other unanticipated causes. Disaster Recovery process detailing prevention, containment and recovery functions on a timely basis to recover business operations, protect critical infrastructure and assets is a critical part of this policy.
    • Vendor Management: Manage third party vendor operations and support activities in support of regulatory or other supervisory obligations as well as ensuring a good value for money from this technology or operations expenditure.
  • Policy Assurance Management: Manages the specification and adherence to the above policies by the technology, business and operations organizations.

A Primer on Data Management

A number have of folks have asked me about my principles behind managing data. For me, I always apply first principles:

Types of data –

  1. Reference data  – major business entities and their properties; For e.g. and investment bank may consider client, securities and product information to be reference data; A pharmacy may consider Drug, Product, Provider, Patient to be reference data
  2. Master data – this is core business reference data of broad interest to a number of stakeholders; In this case an organization may want to master this data to identify entities that are the same but referenced differently by different systems or stakeholders; Typically you would use an MDM tool to achieve this.
  3. Transaction data – Events, Interactions and transactions. This measures the granular transactions that  different entities do either for trade, or transaction or service. For e.g. an investment bank may have deal transactions, or trade data from sales and trading desk that may be another example. A pharmacy may similarly have Rx fulfillment records as transaction data.
  4. Analytic data – Inference or analysis results derived from transaction data combined with reference data through various means such as correlation or regression etc.
  5. Meta data – data about data such as its, definition, form and purpose
  6. Rules data – Information governing system or human behavior of a process

Types of data storage paradigms –

  1. Flat files – usually used for unstructured data like log files
  2.  DBMS – data base management systems
    1. Hierarchical – a scheme that stores data as a tree of records, with each record having a parent and multiple children for e.g. IBM IMS (Information Management System). Any data access begins from the root record. My first experience with this was while  programming at CSX and British Telecom.
    2. Network – a modification of the hierarchical scheme above to allow for multiple parents and multiple children thus forming a generalized graph structure invented by Charles Bachman. It allows for a better modeling of real life relationships between natural entities. Examples of such implementations are IDS and CA IDMS (Integrated Database Management Systems). Again saw a few implementations at CSX.
    3. Relational or RDBMS – based on the relational model invented by Edgar F Codd at IBM. The general structure of a DB server consists of a storage model (data on disk organized in tables (rows and columns) and indexes, logs and control files), a memory model (similar to storage but consisting only of a portion of most frequently accessed data cached in memory + meta code, plan and SQL statements for accessing that data) and a process model (consisting of a reader, writer, logging and checkpoints). Most modern relational databases like DB2, Oracle, Sybase, My SQL, SQL Server etc. follow a variation of the above. This is by far the most prevalent DBMS model.
    4. Object  or ODBMS is where information is stored in the form of objects as used in OOP. These databases are not table oriented. Examples are Gemstone products (which are now available as Gemfire object cache which is notable for complex event processing, distributed caching, data virtualization and stream event processing) and Realm available as an open source ODBMS.
    5. Object-Relational DBMS which aim to bridge the gap between relational databases and object oriented modeling techniques used in OOP via allowing complex data, type inheritance and object behavior; examples include Illustra and PostgreSQL. Although most modern RDBMS like DB2, Oracle DB, SQL Server now claim  to support ORDBMS via compliance to SQL:1999 via structured types.
    6. NoSQL databases allow storage and retrieval of data modeled outside of tabular relations. Reasons for using them stem from scaling via clusters, simplicity of design and finer control over availability. Many compromise consistency in favor of availability, speed and partition tolerance. A partial list of such databases from wikipedia is as follows –
      1. Column: Accumulo, Cassandra, Druid, HBase, Vertica
      2. Document: Apache CouchDB, ArangoDB, BaseX, Clusterpoint, Couchbase, Cosmos DB, IBM Domino, MarkLogic, MongoDB, OrientDB, Qizx, RethinkDB
      3. Key-value: Aerospike, Apache Ignite, ArangoDB, Couchbase, Dynamo, FairCom c-treeACE, FoundationDB, InfinityDB, MemcacheDB, MUMPS, Oracle NoSQL Database, OrientDB, Redis, Risk, Berkley DB, SDBM/Flat File dbm
      4. Graph: AllegroGraph, ArangoDB, InfiniteGraph, Apache Giraph, MarkLogic, Neo4J, OrientDB, Virtuoso
      5. Multi-model: Apache Ignite, ArangoDB, Couchbase, FoundationDB, InfinityDB, Marklogic, OrientDB

Common Data Processing Paradigms and Questions about why we perform certain operations –

  • Transaction management – OLTP
    • Primarily read access – Is when a system is responsible for reading reference data but not maintaining it. A number of techniques can be utilized for this but primarily the approach is read-only services providing data realtime, readonly stored procs for batch or file access. A number of times people prefer to replicate a read only copy of the master database to reduce contention on the master.
    • Update access – Usually driven off a single master database to maintain consistency with a single set of services or jdbc/odbc drivers providing create/update/delete access, but certain use cases may warrant a multi-master setup.
    • Replication solutions – unidirectional (master-slave), bi-directional, multi-directional (multi-master) or on-premises to cloud replication solutions are available.
  • Analytics – OLAP
    • Star schema – a single large central fact table and one table for each dimension.
    • Snow flake – Is a variant of the star schema model where there still is a single large central fact table and one or more dimension tables, but the dimension tables are normalized in to additional tables.
    • Fact constellation or Galaxy: A collection of star schemas, which is a modification of the above where multiple fact tables share dimension tables.
  • When to create data warehouses vs. data marts vs. data lakes?
    • Data Warehouse – A data warehouse stores data that has been modeled and structured. It holds multiple subject areas with very detailed information and works to integrate all these data sources. It is available for business professionals for running analytics to support their business optimizations. It is fixed configuration, less agile and expensive for large data volumes with a mature security configuration. May not necessarily use a dimension model but feeds other dimension models.
    • Data marts – a mart that contains a single subject area, often with rolled up or summary information with the primary purpose of integrating information from a given subject area or source systems.
    • Data lakes – On the other hand contain structured, semi-structured, unstructured and raw data that is designed for low cost storage whose main consumers are data scientists who want to figure out new and innovative ways to use this data

Defining what your needs are for each of the above dimensions will usually allow you to choose the right product or implementation pattern for getting the most out of your system.

How To Measure Delivery Effectiveness For An IT Team

Common measures that should drive an application or application development team’s metrics collection and measurement:

  • Cadence – how frequent and regular is the release cycle
    • the number of releases per year
    • the probability of keeping a periodic release
  • Delivery throughput – how much content (functionality) is released every release
    • measures such as jira counts weighted by complexity or size
  • Quality – number of defects per cycle
    • defect counts from a defect management system such as ALM or quality center
    • change requests raised post dev commencement
  • Stability – Crashes/ breakage/incidents around the application
    • Crashes
    • Functionality not working
    • Application unavailable
    • Each of the above could be measured via tickets from an incident management system like Service Now
  • Scalability – how easily does the application expand and contract based on usage
    • measure application usage variability across time periods – for e.g. we planned for usage to double for Rx fulfillment at mail order pharmacies during Thanksgiving and Christmas  holidays than normal weeks
    • application scaling around peak usage + a comfortable variance allowance
    • shrinkage back to adjust to non peak usage to effectively manage TCO  and use capacity on demand techniques
  • Usability – how well and easily can your users access or work the application
  • Business Continuity
    • ability to recover in the event of a disaster
    • time to restore service in a continuity scenario

In my opinion, some key pre-requisites that drive good metrics are –

  • Good design and architecture
  • Code reviews and design conformance
  • Scalability isn’t an after thought
  • Usability is designed before the software is written
  • Automated regression and functional testing

I have implemented versions of delivery effectiveness for my teams at both Morgan Stanley and Medco and contrary to most practitioners beliefs, its not that hard to do.  Please reach out if you want a deeper how to discussion.

Part IIa: In Defense Of Government

This weekend I was listening to Fareed Zakaria on GPS @CNN (a program that I love) and he mentioned another aspect of government that I hadn’t covered in my post on “In Defense of Government”

His point was that we look towards our government to avoid catastrophes – and he mentioned this in respect to the climate crisis.

What really got me thinking was – this is a crucial and very under appreciated function. Essentially if the government is successful in averting the crisis, it is a non event (who remembers the collective action to fix the ozone layer hole in the atmosphere and globally phasing out CFL based coolants in refrigeration), since history does not remember the mundane – and hence the success of the institution is always under appreciated.

While if the government fails spectacularly (for e.g. The World Wars – that’s one for the history books – recounted and studied as a tale of misery and suffering for generations).

So how do we address this inherent bias in human nature – probably by also including our spectacular (although under appreciated) successes in avoiding crisis and a careful meticulous analysis of failure of strategy and policy on disasters – not just a tale of human suffering.

Part V: Future Of Work

Future Disruptions and New Maladies – what the future may hold…..

  • An aging population without a plan to take care of our old and infirm.
  • AI and ML: Machines are getting smarter and more intelligent. AI seems to be able to do a lot of the cognitive jobs currently held by humans.
  • Automation: Think self driving cars, trucks and other vehicles; IVRs that perform the jobs of CSRs, chat bots etc.
  • Are humans a single planet species? Can we defy gravity at scale (mass transportation as opposed to a few infrequent transgressions into space) – Will this open up new frontiers to explore and eventually inhabit new worlds?
  • Will we discover other intelligent species/civilizations? Again new frontiers for engagement outside our current boundaries of work – think Star Ship Enterprise and its crew – “Space: the final frontier. These are the voyages of the Starship Enterprise. Its continuing mission: to explore strange new worlds; to seek out new life and new civilizations; to boldly go where no one has gone before”.

All of these can be looked at as either opportunities or threats – it is what we make of it.  Change is never comfortable, but depending on how we embrace and adapt to it may mean our survival or ultimately demise.

Our response to these changes may take the following shape –

Protectionist Policies – Have they ever worked?

When we domesticated animals, did humans that performed manual labor, resist the entry of animals? – no, instead they evolved to managing these animals and accomplishing more work than what they could do individually.

Did humans resist mechanization – yes, but it wasn’t a disruption that they could resist for long because industrialization came with a number of benefits: it raised living conditions, increased life expectancy and also provided a preponderance of additional time that could be productively used in the pursuit of other interests and goals.

So why do we believe that the same response will be successful for the next round of redefinition of work?

Innovation: Can we reimagine work that humans do?

Why do we assume assembly line work is actually adding value?

Humans were first domesticated by agriculture and forced to leave their hunter-gatherer life style. For work that needed more strength than a single human, we used animal power for tasks such as ploughing or extracting oil.

Then came automation – where we invented gears, pulleys and mechanical arms or wheels driven by motors and generators to perform the  work on our behalf.

Next came CNC machines which in addition to the mechanical aspect of doing the job, could also be programmed to do the work without human intervention.

The final frontier is AI – where an automaton (or a software program since not all realms of work are physical) could sense the environment and determine the best action in order to achieve a set of finitely defined goals

I think we are ok as long as “we” get to define the goals but there are larger fears in society that when these automatons/programs take over and set their own goals – why would any human be needed?

Is that the right question? I do not know … does anyone?

Can AI and Intelligent robots really be an ally instead of a threat?

True if we do not hang on to our traditional definition for work and instead look for different ways to create value.

Will be a possibility if an alien species attacks us and we collaborate with our own robots to ward off this threat.

May be necessary if humans are not suited to be a space faring race and we need robots to help us in this hostile environment.

We will need them when we are older and frail and younger humans do not have the inclination or interest to look after us.

If we want to succeed, we will need to change the game …and have a plan for our workforce to transition to this new definition of work.

 🙂


Part III: Consequences Of Rampant Capitalism…

We have seen a rapid growth in various world economies over the last century. It has been especially pronounced after world war II. Although of late this growth is not equally shared across the population. This results in income inequality and a sub set of the population loses all hope for upward mobility.

This segment of population is completely discounted and does not value the democratic choice that they exercise in elections, and consequently they make their decisions based on either  unachievable promises or even protectionist and racist policies.


Once the value of the vote goes down, what you see is election of Incompetent or Callous leaders into the government, which further endangers the existence of democracy or capitalism.


Now don’t get me wrong, Capitalism is the only economic system we have seen work – all others like socialism, communism, dictatorship, fascism etc. have all failed the test of time. The question really is how to temper capitalism to not become its own biggest enemy and threaten its own (and democracy’s) survival.


Our next post is a plan to tackle this….