
My son’s team had qualified for the rescue line competition at the international RoboCup 2018 competition in Montreal Canada. While his team did not do as well (26 out of 38 teams) – it was a great learning experience. Since it was our first international competition, we were also awed by the level of the competition as well as the advanced robotics capabilities on display.
Here’s a description of some of the advances we saw at the conference.
Tickets:
We got 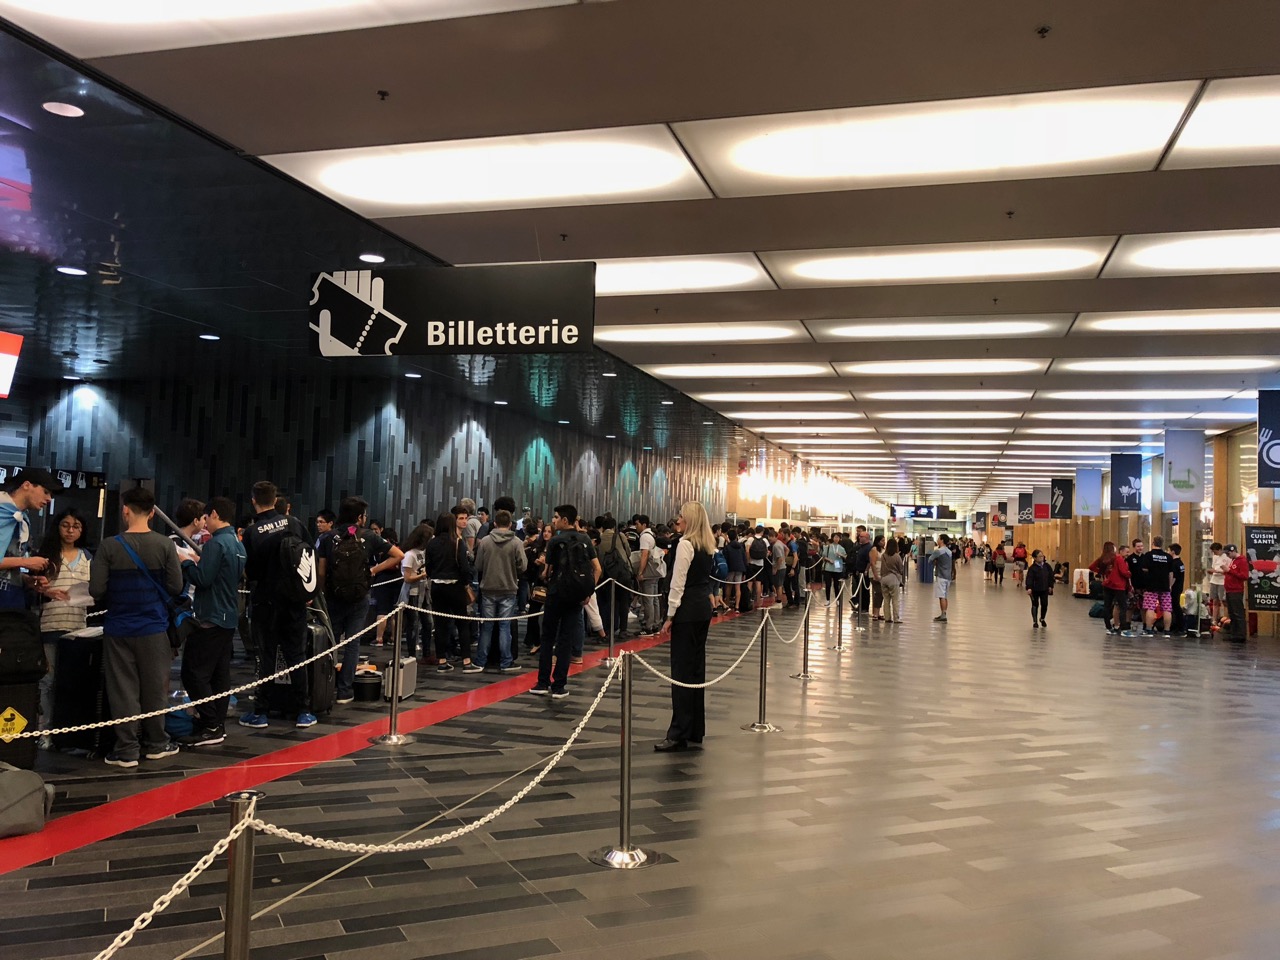 tickets early in the morning on Sunday June 17th, and the rest of the day went in team setup, practice runs and calibration & tuning the robotics programs.
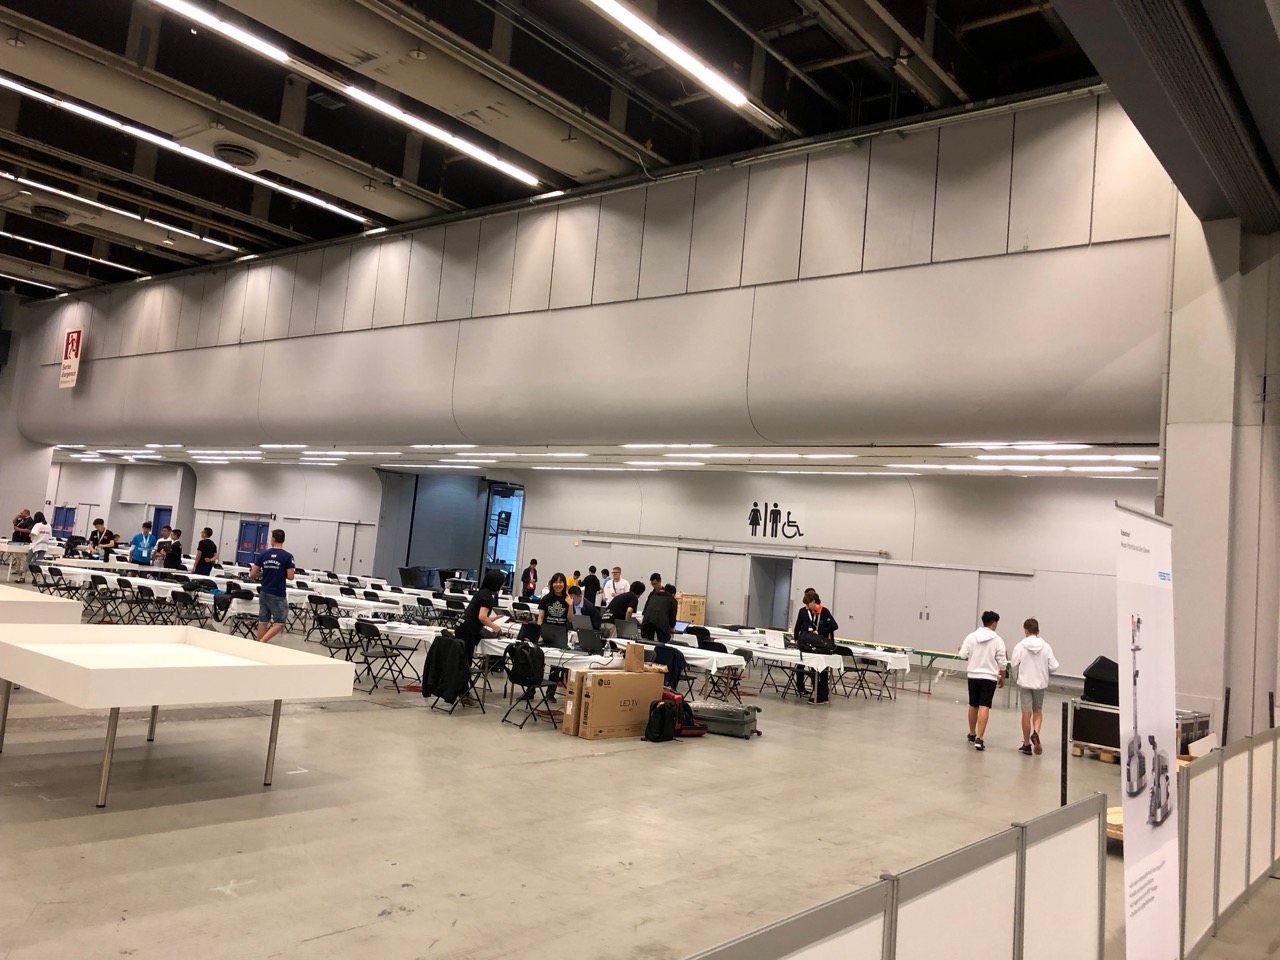
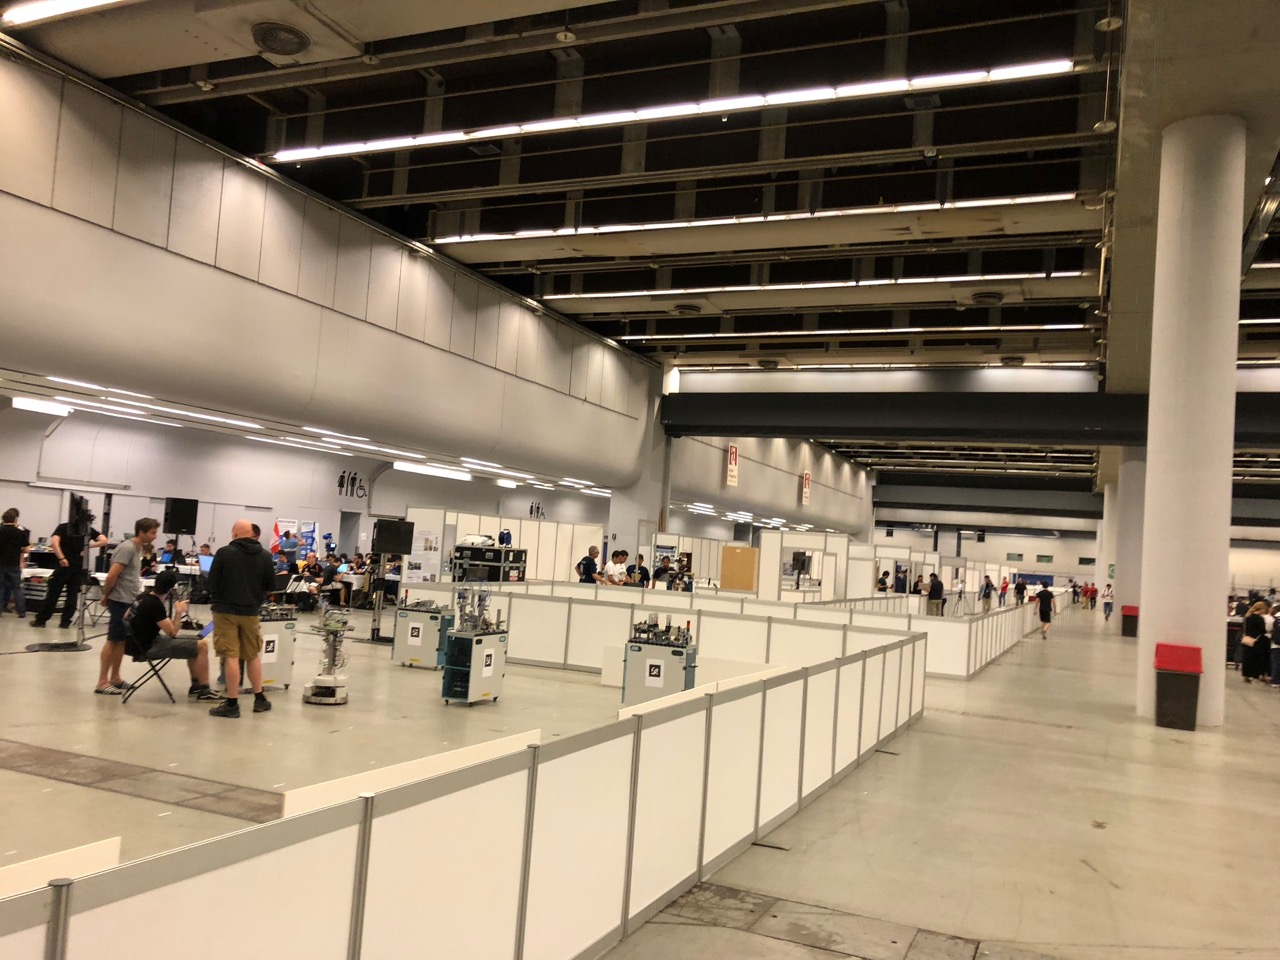
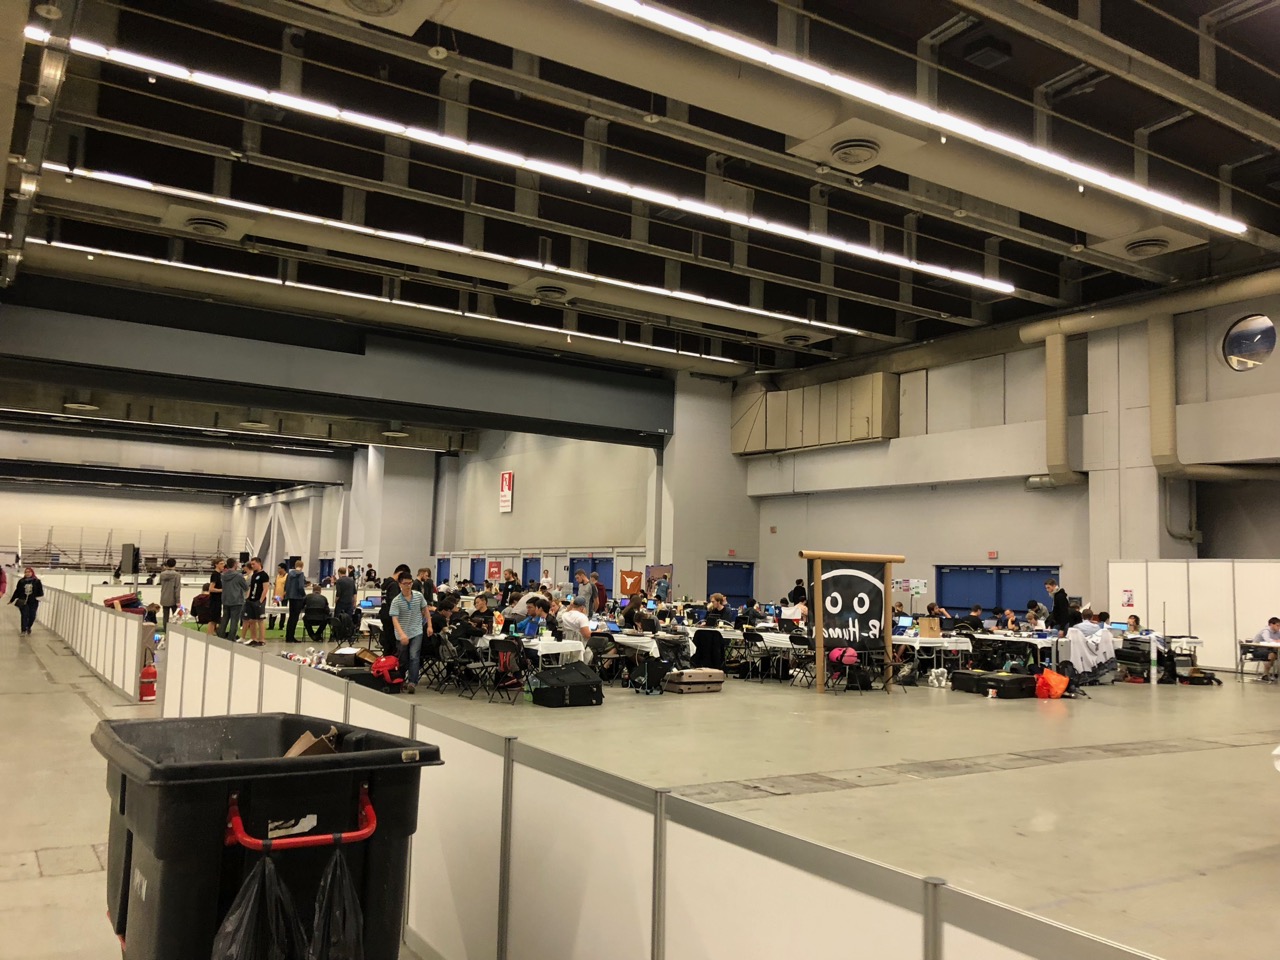
Setup:
Sunday, June 17 was for setup at the Palais De Congres in Montreal.


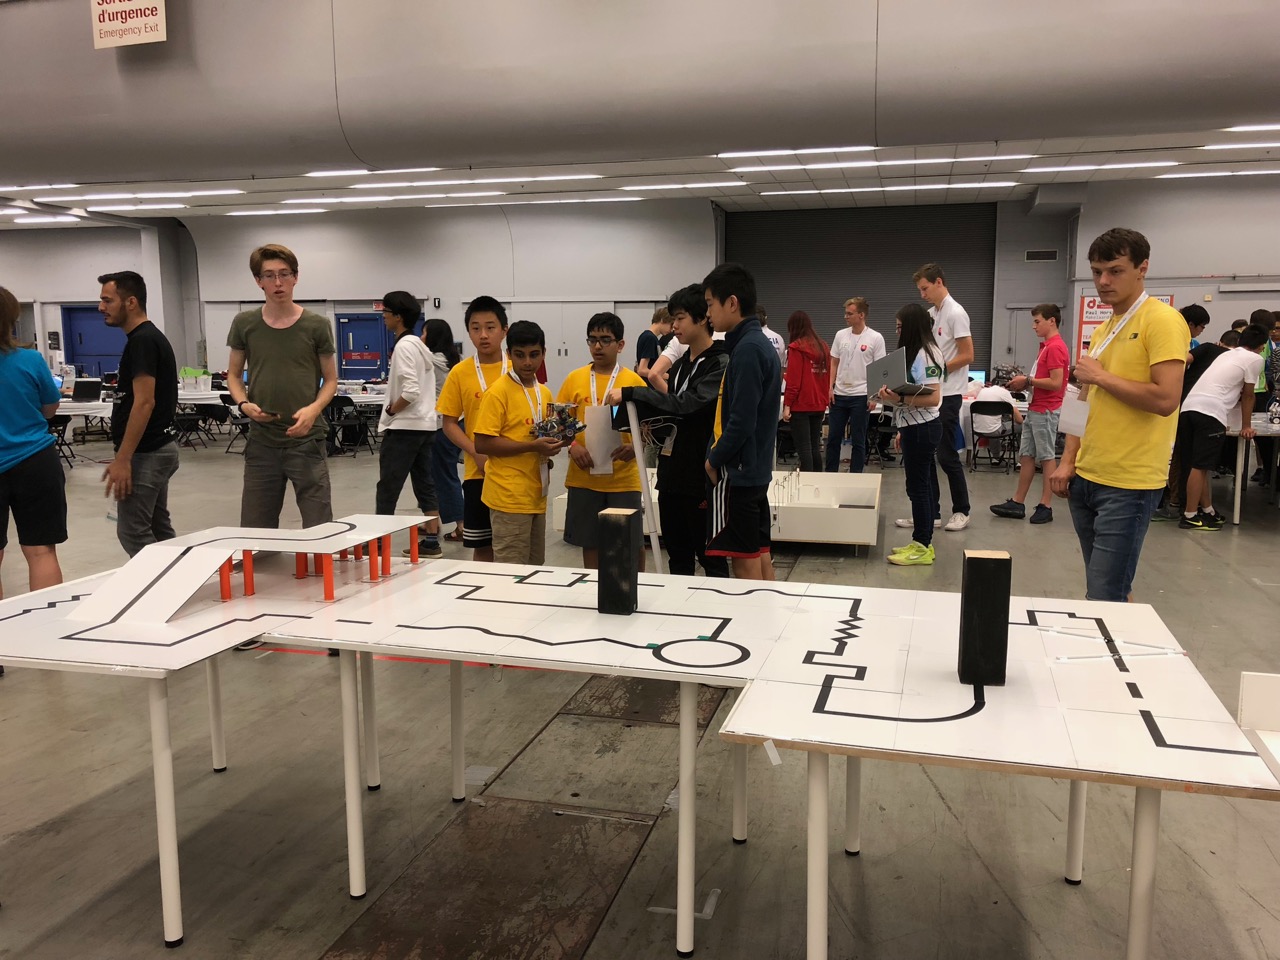
Rescue Line Competition:
The competition primarily consisted of teams building their own bots to navigate a variety of challenges like line tracing, navigating left, right and U turns, navigating road bumps, debris and obstacles, tackling ramps, bridges etc. In addition being able to score points in the rescue room by identifying victims and carrying them to the respective rescue zones. All of this was to be available as capabilities of the bot and to use sensors to autonomously navigate through the obstacle course and accomplish the above mentioned tasks.
Rescue Line Winning Team – Iranian Kawash. The following is a video of their winning robot in the rescue zone.
Sid’s Team run –
Winning Robot: Team Kavosh from Iran

Rescue Maze Competition:
The objective of the rescue maze competition is for a robot to navigate a complex maze and identify victims to save.
Team Soccer:
Autonomous bots in a team playing soccer. The soccer tournament came a various levels –
Middle Size League:
Powerful bots playing soccer with a full size soccer ball. Here’s a video of a 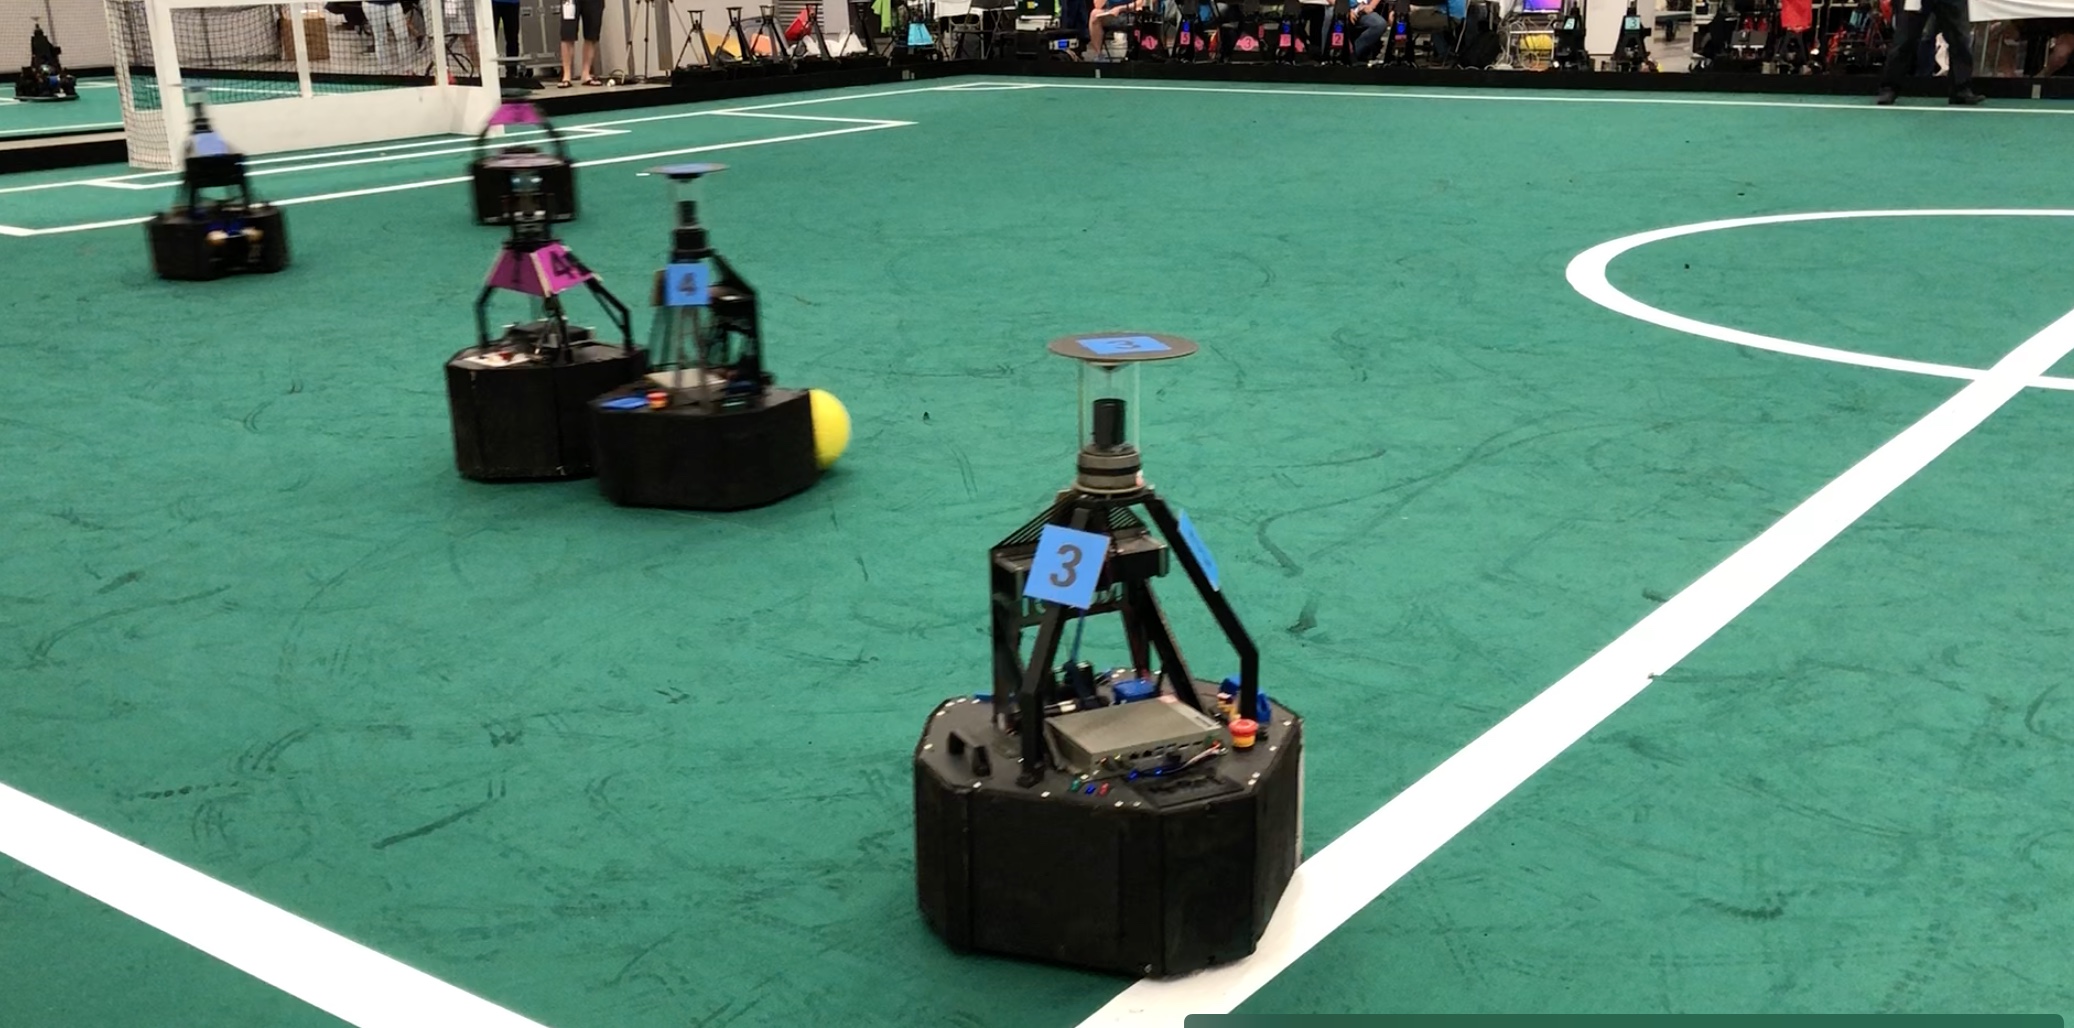 goal from one of the teams.
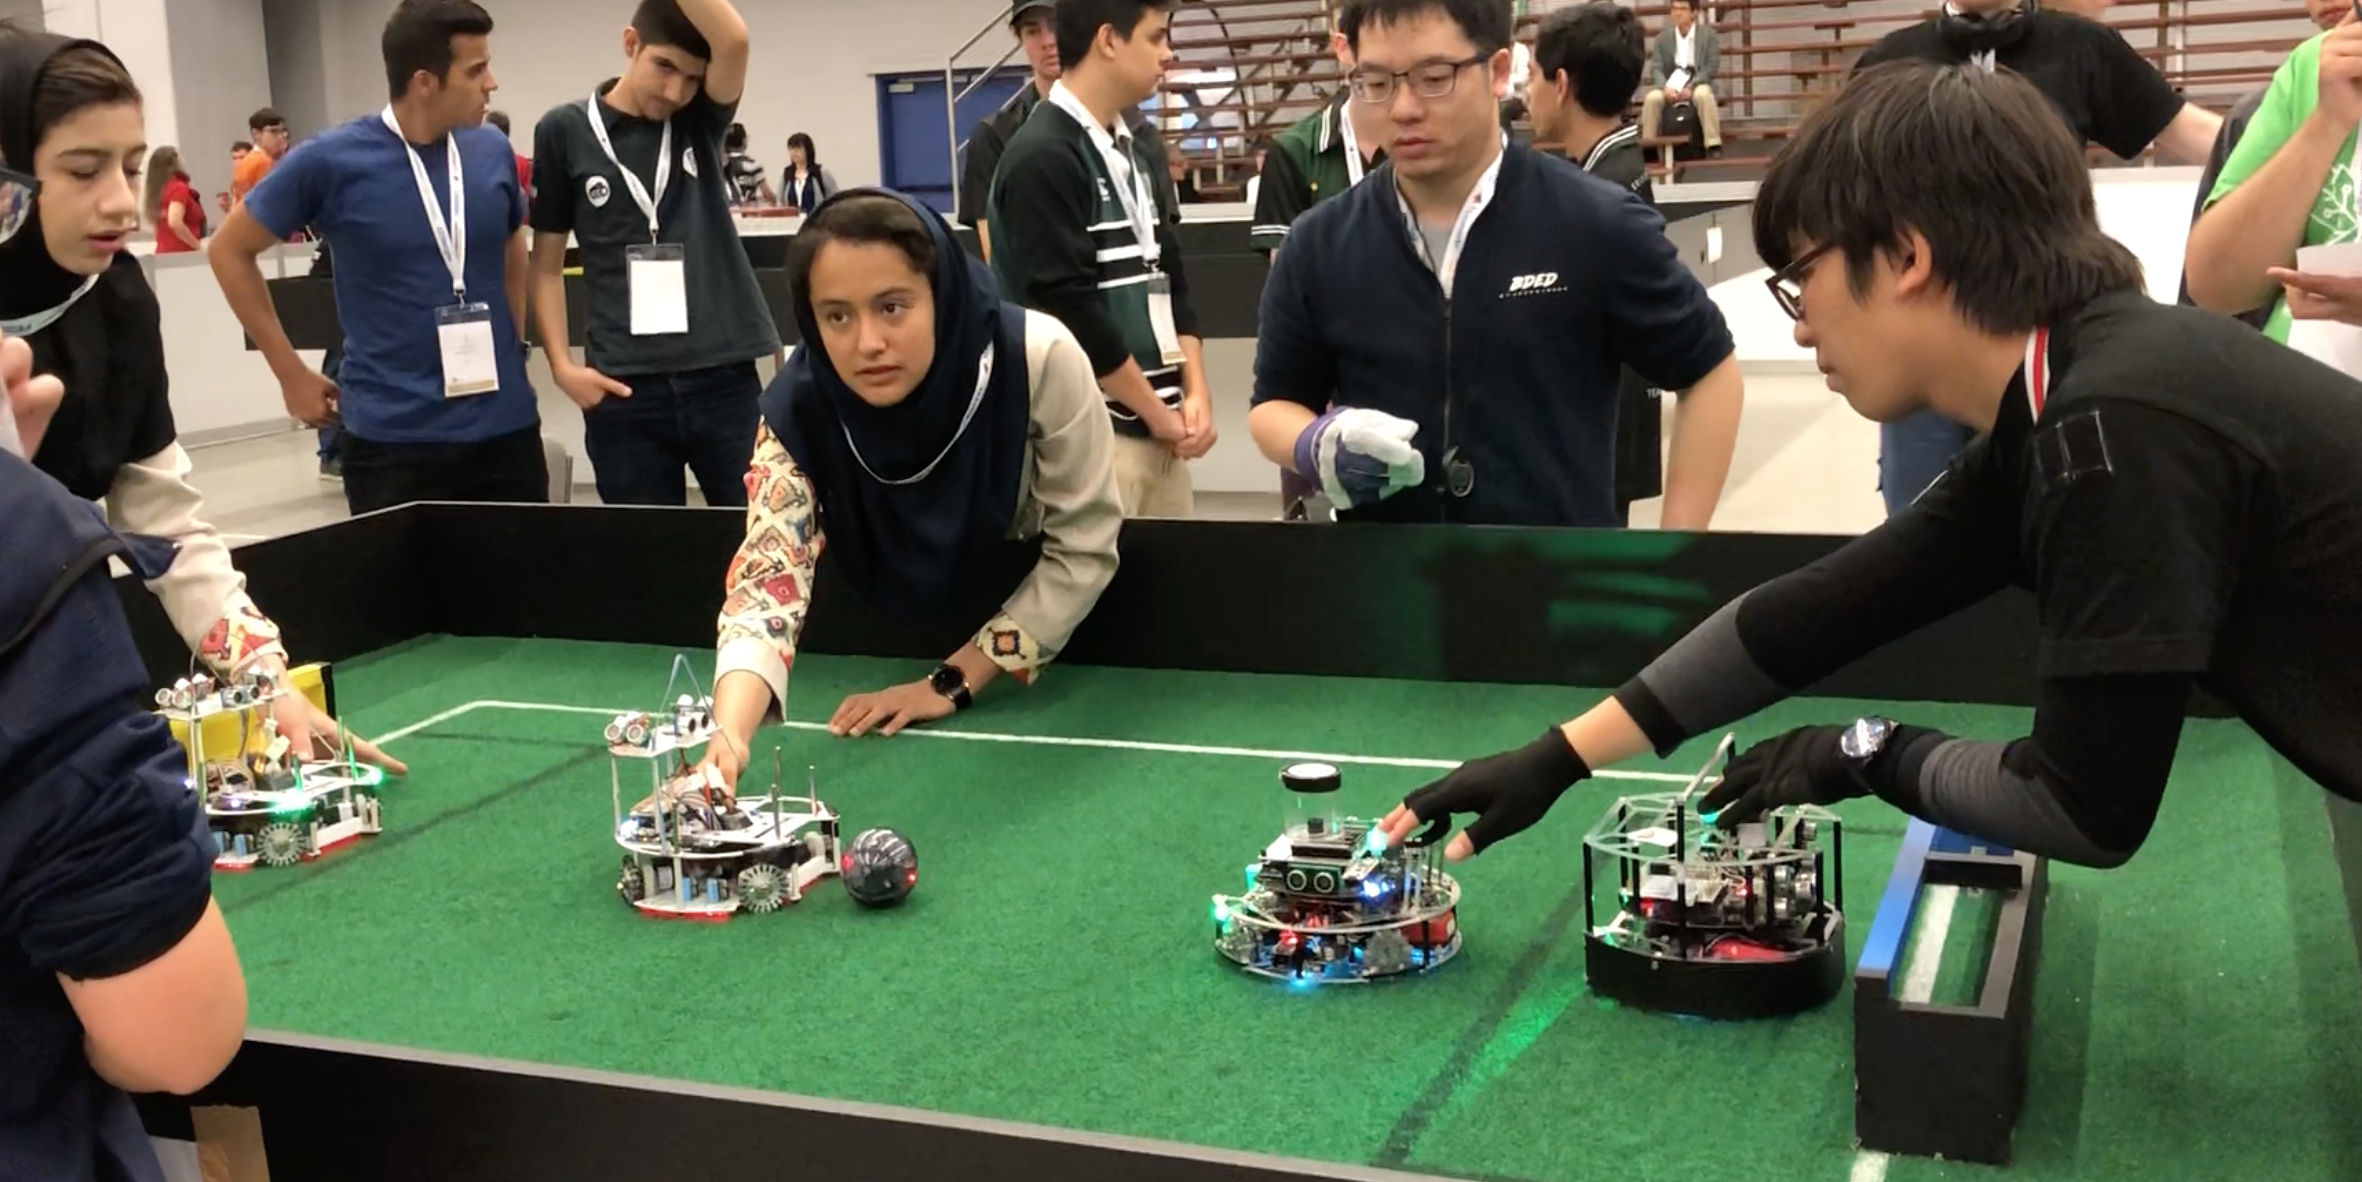
Junior League:
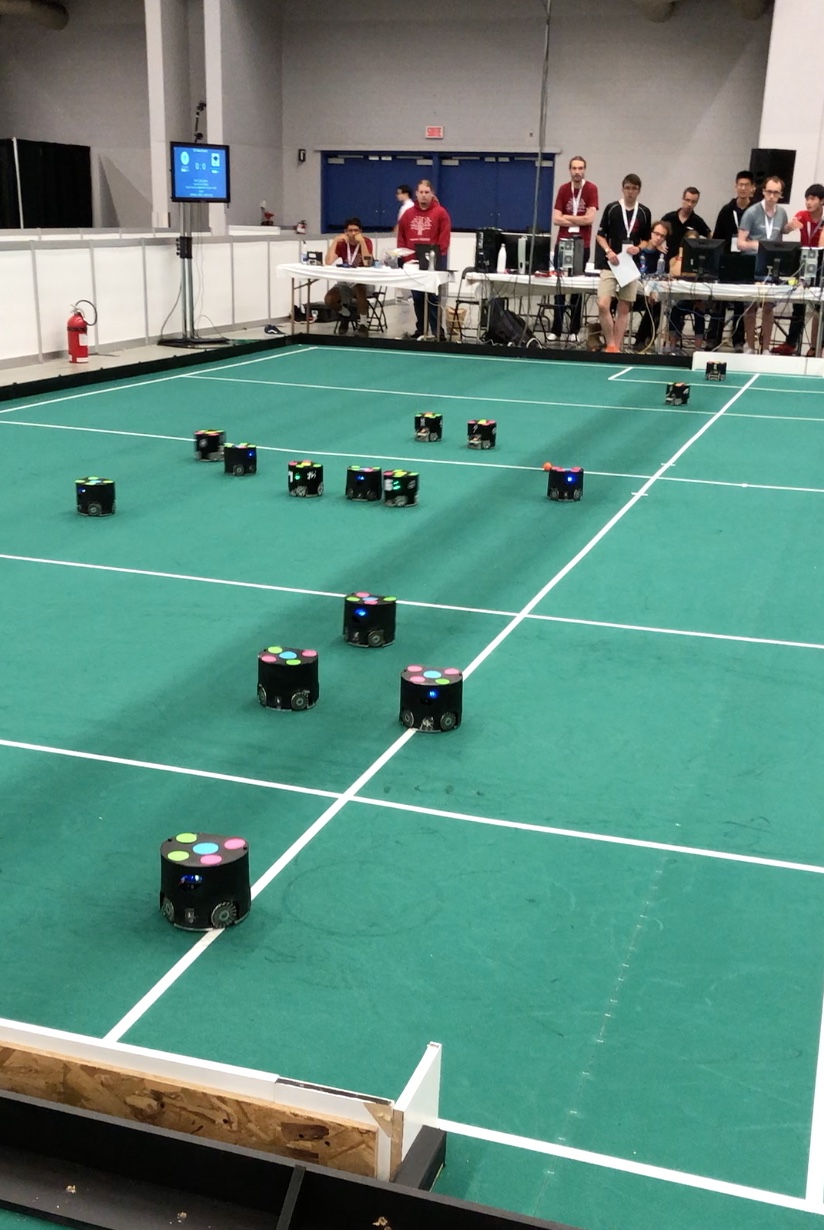 A very fast paced soccer game with bots acting in coordination as one team against an opposing team. Here’s a video that shows how exciting this can be.
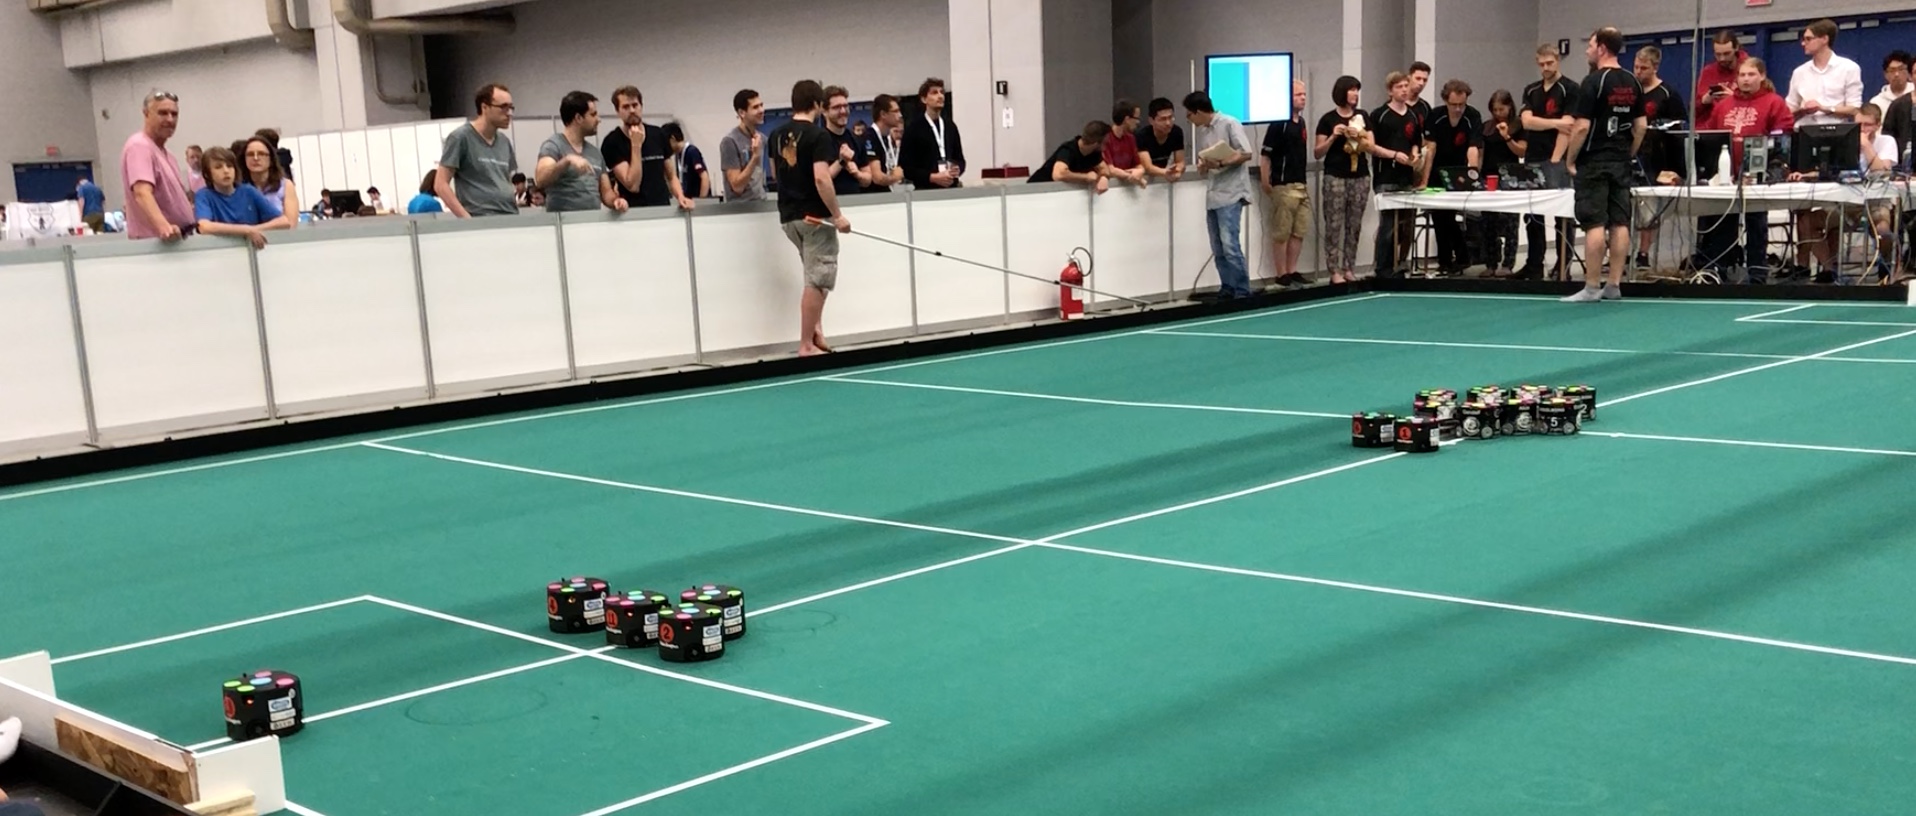
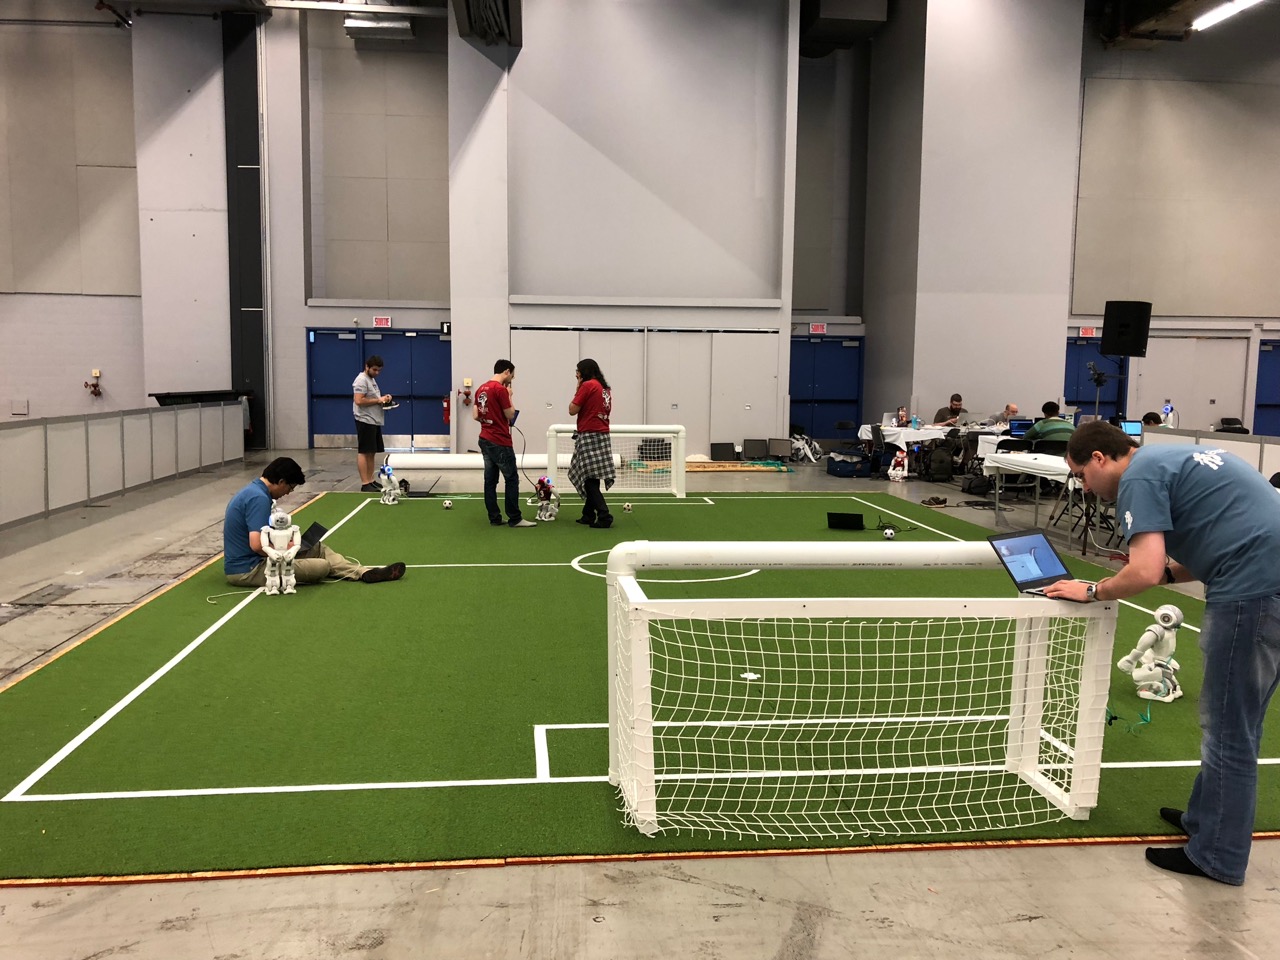
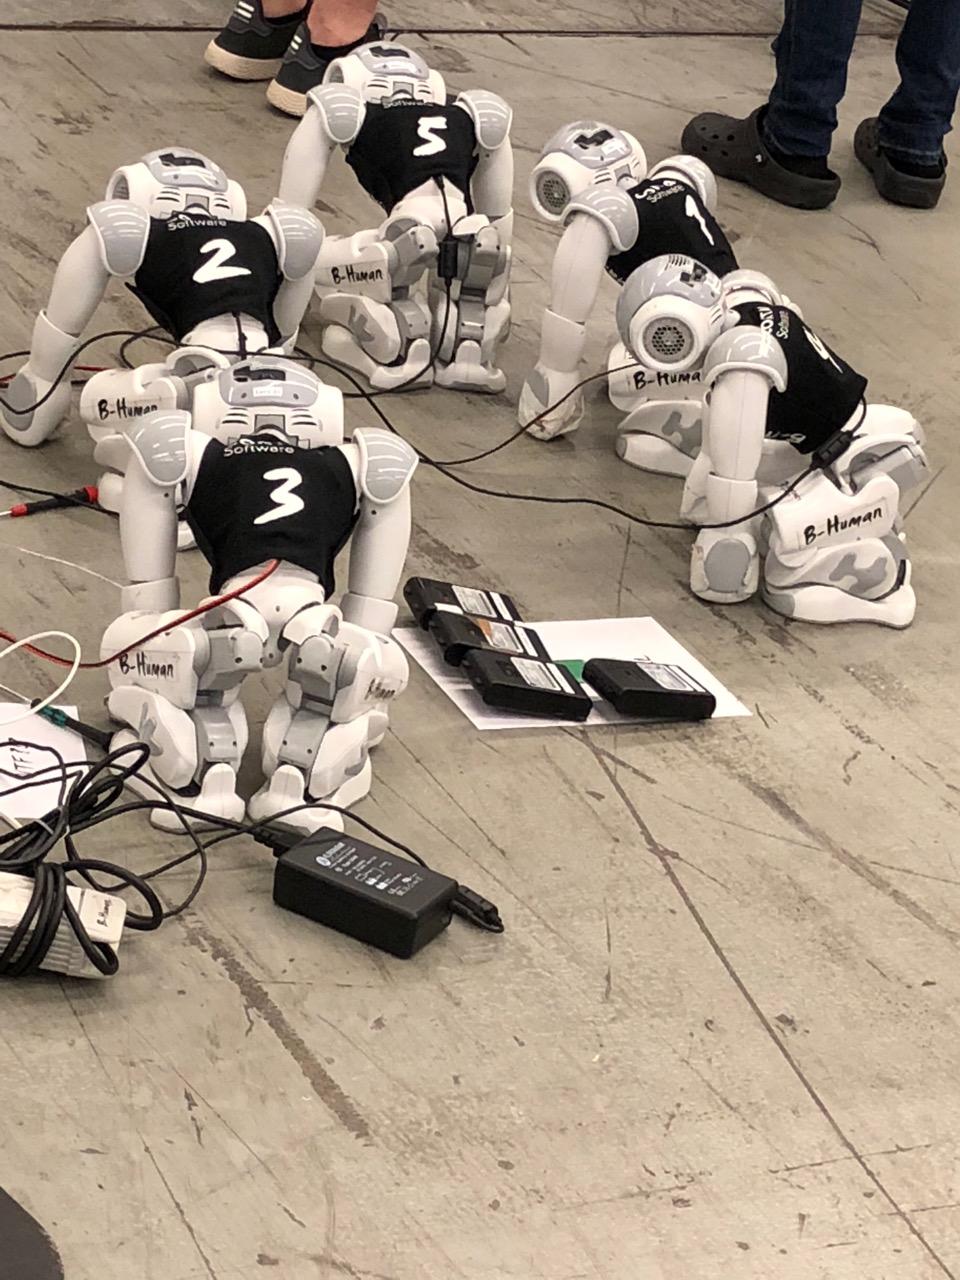
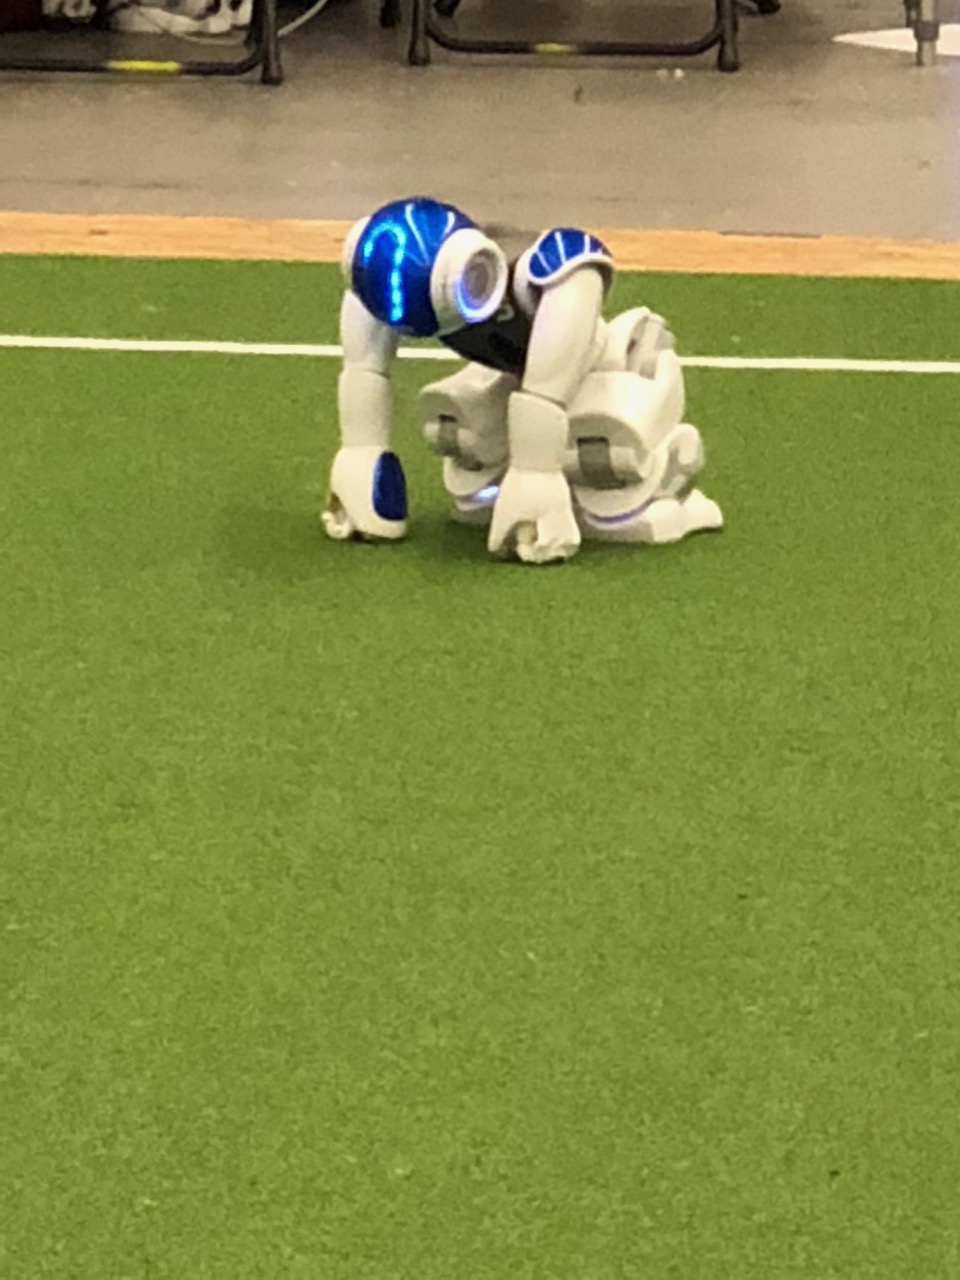
Humanoid Robot Soccer:
There were three categories – Kidsize Humanoid League, Humanoid League 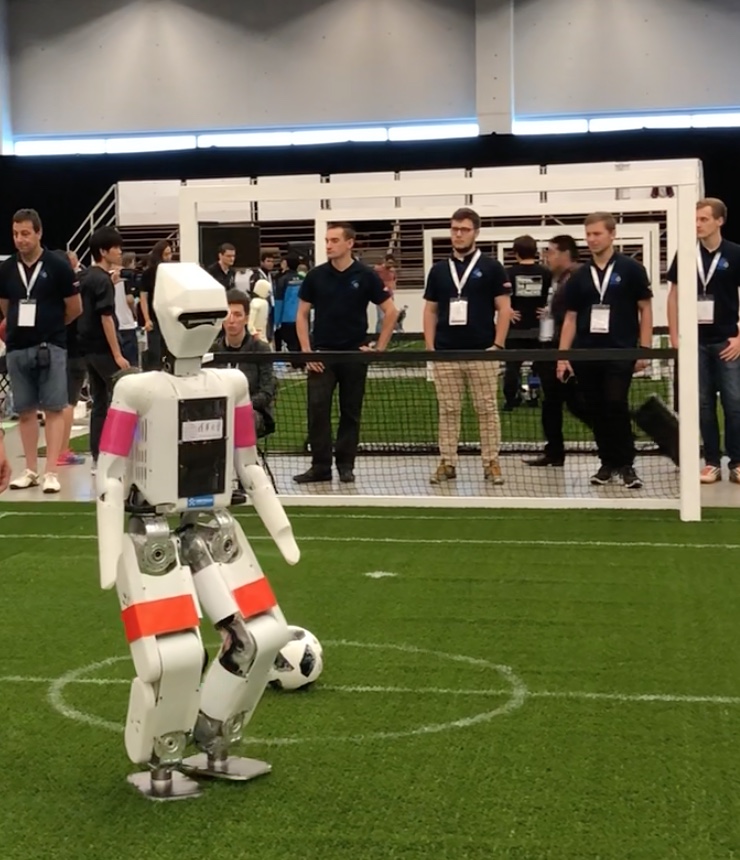
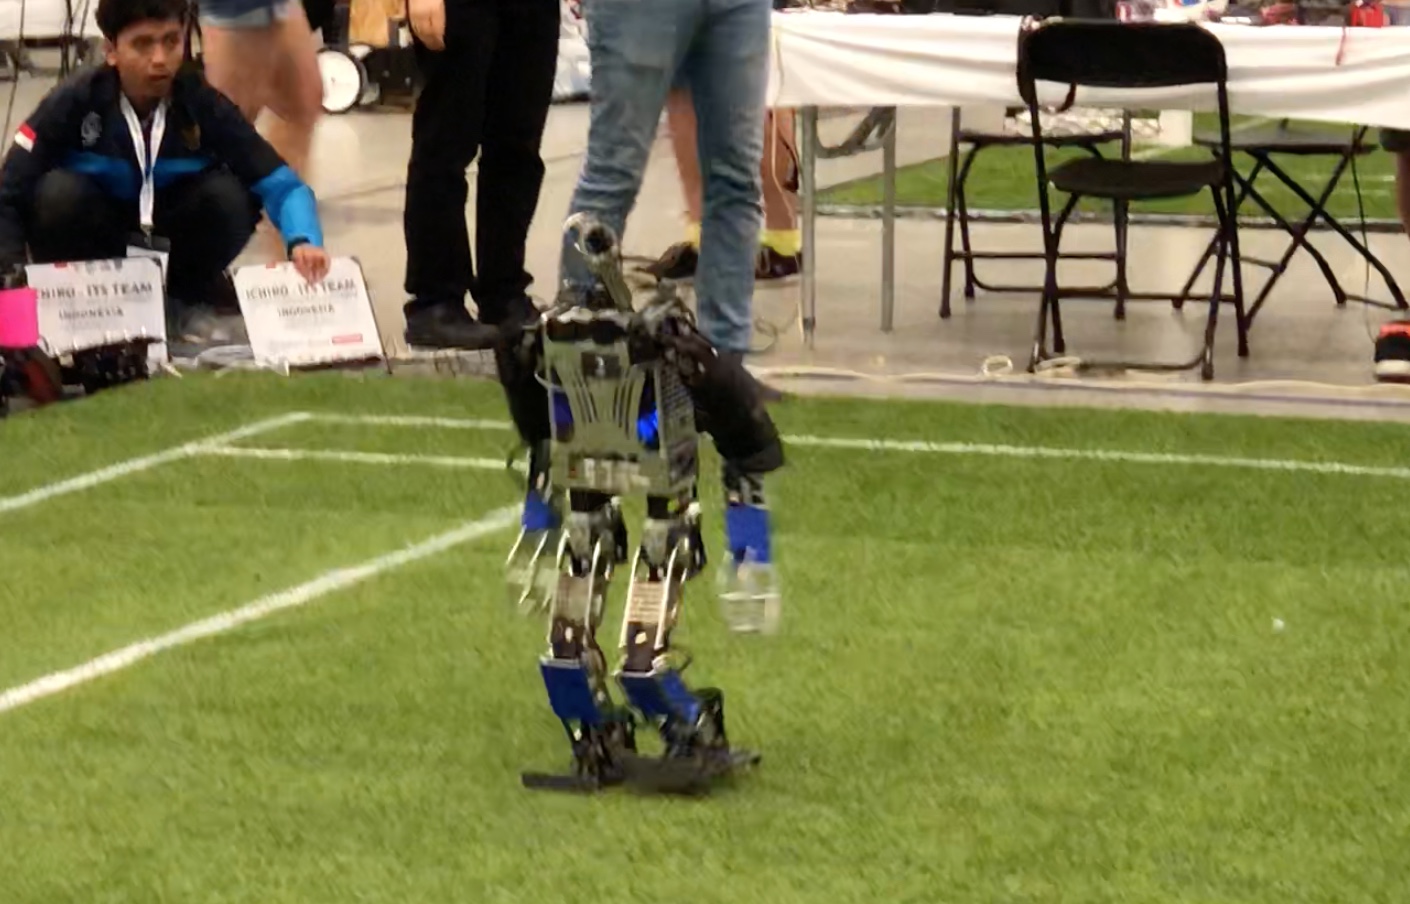
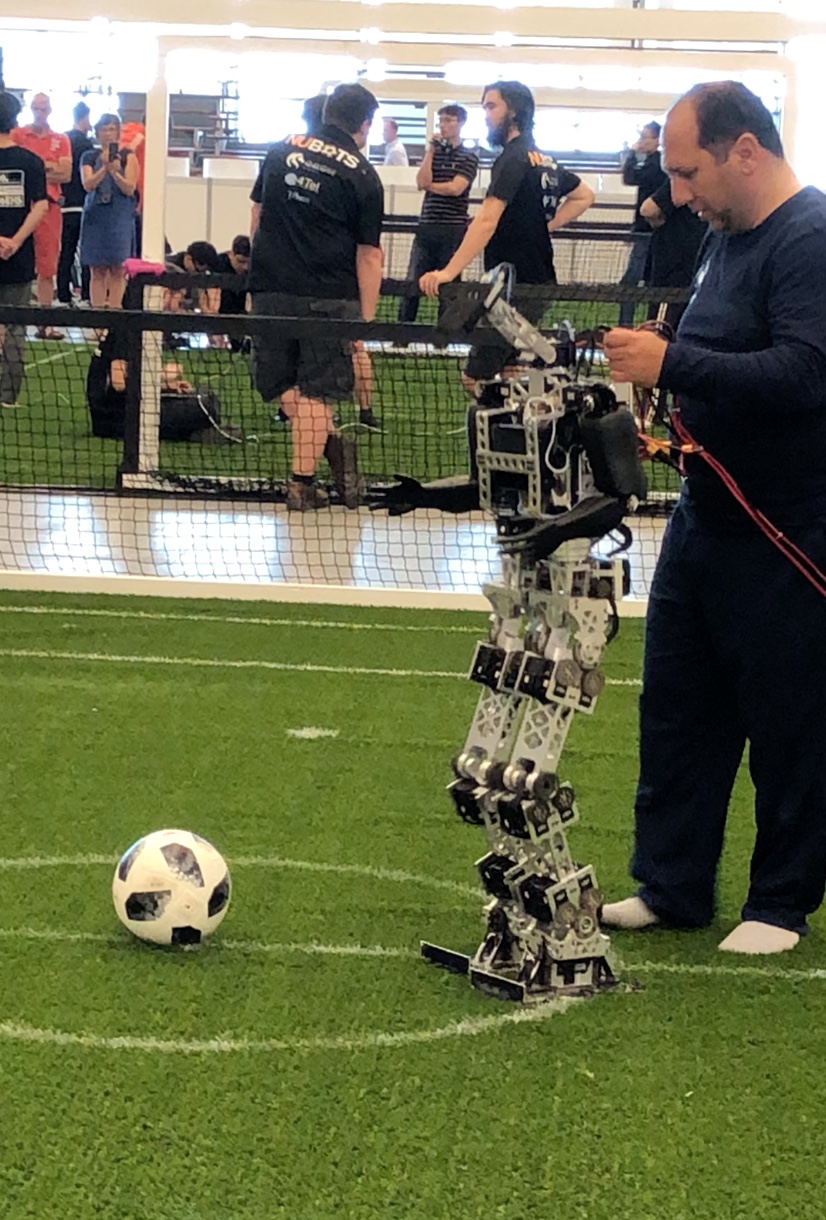
and Standard Platform League. There were mainly two challenges – building a humanoid robot to navigate locomotion challenges of walking while controlling and navigating a ball towards the opponents goal. The Standard Platform (for e.g. using Softbank’s NAO Generation 4) to play as a team the full soccer match. These looked like toddlers who were navigating the challenges of walking, coordinating, sensing and controlling the ball and shooting goals. Overall it was great fun to watch! Do check out the videos below.
Industrial Robots and Others at Work and Home settings:
We saw a number of demonstrations from a number of different companies on industrial robotics. A few are described in the following videos.
 There were a number of other home setting
 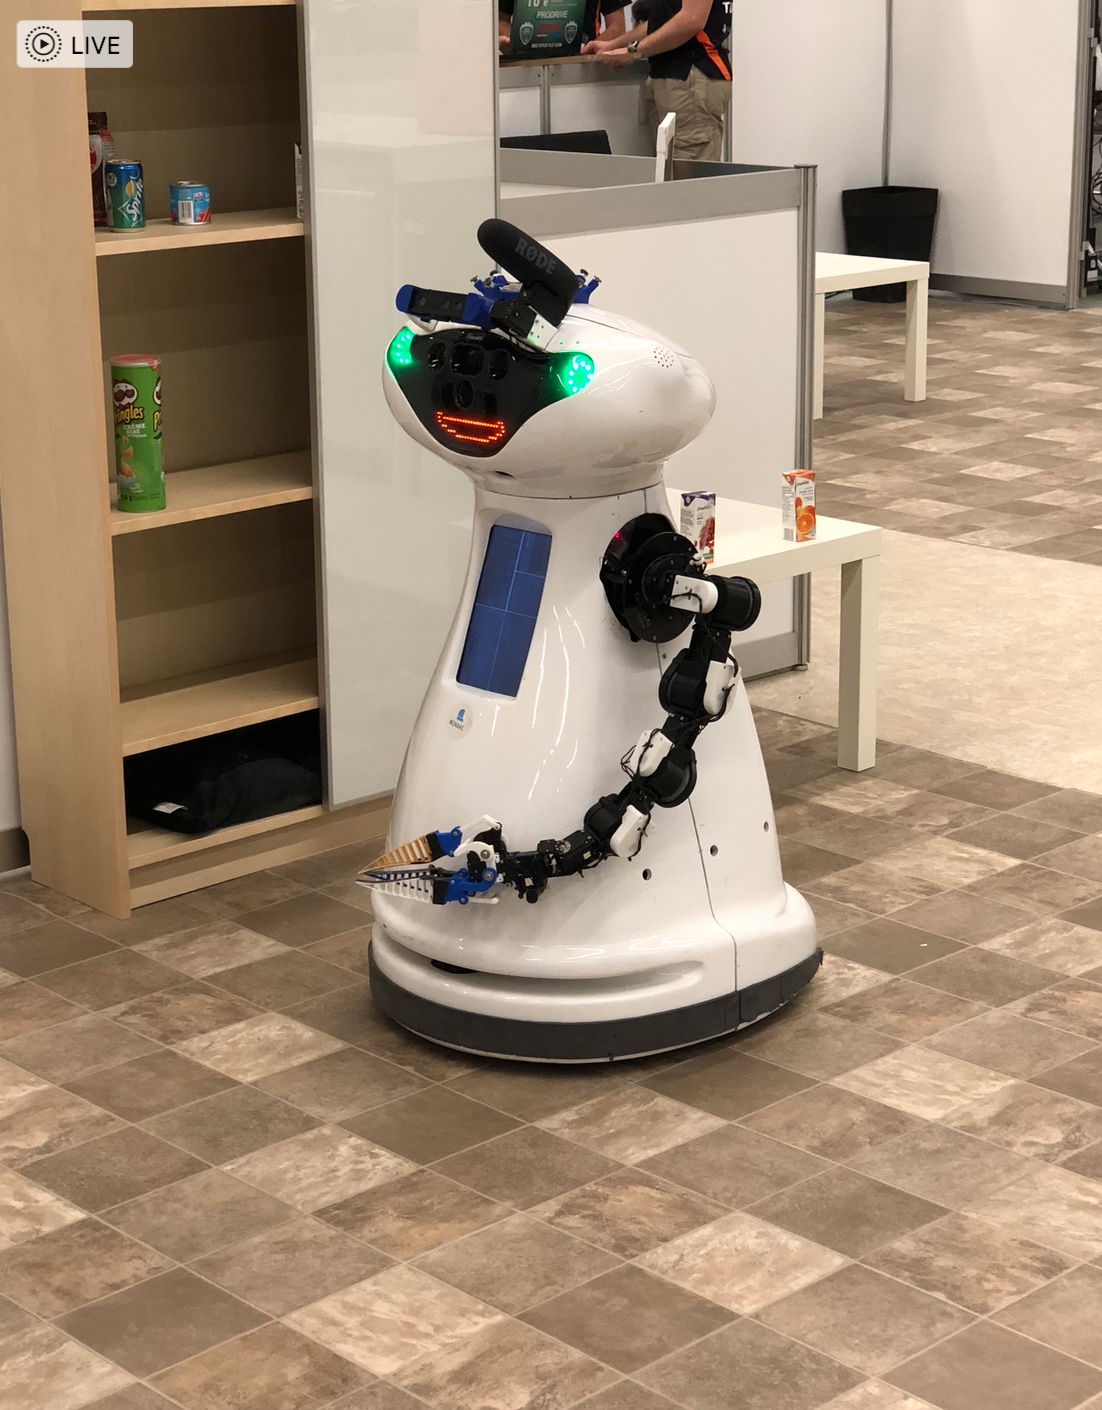 challenges as well – for example unloading grocery bags and storing them in the right location/shelf in a home.
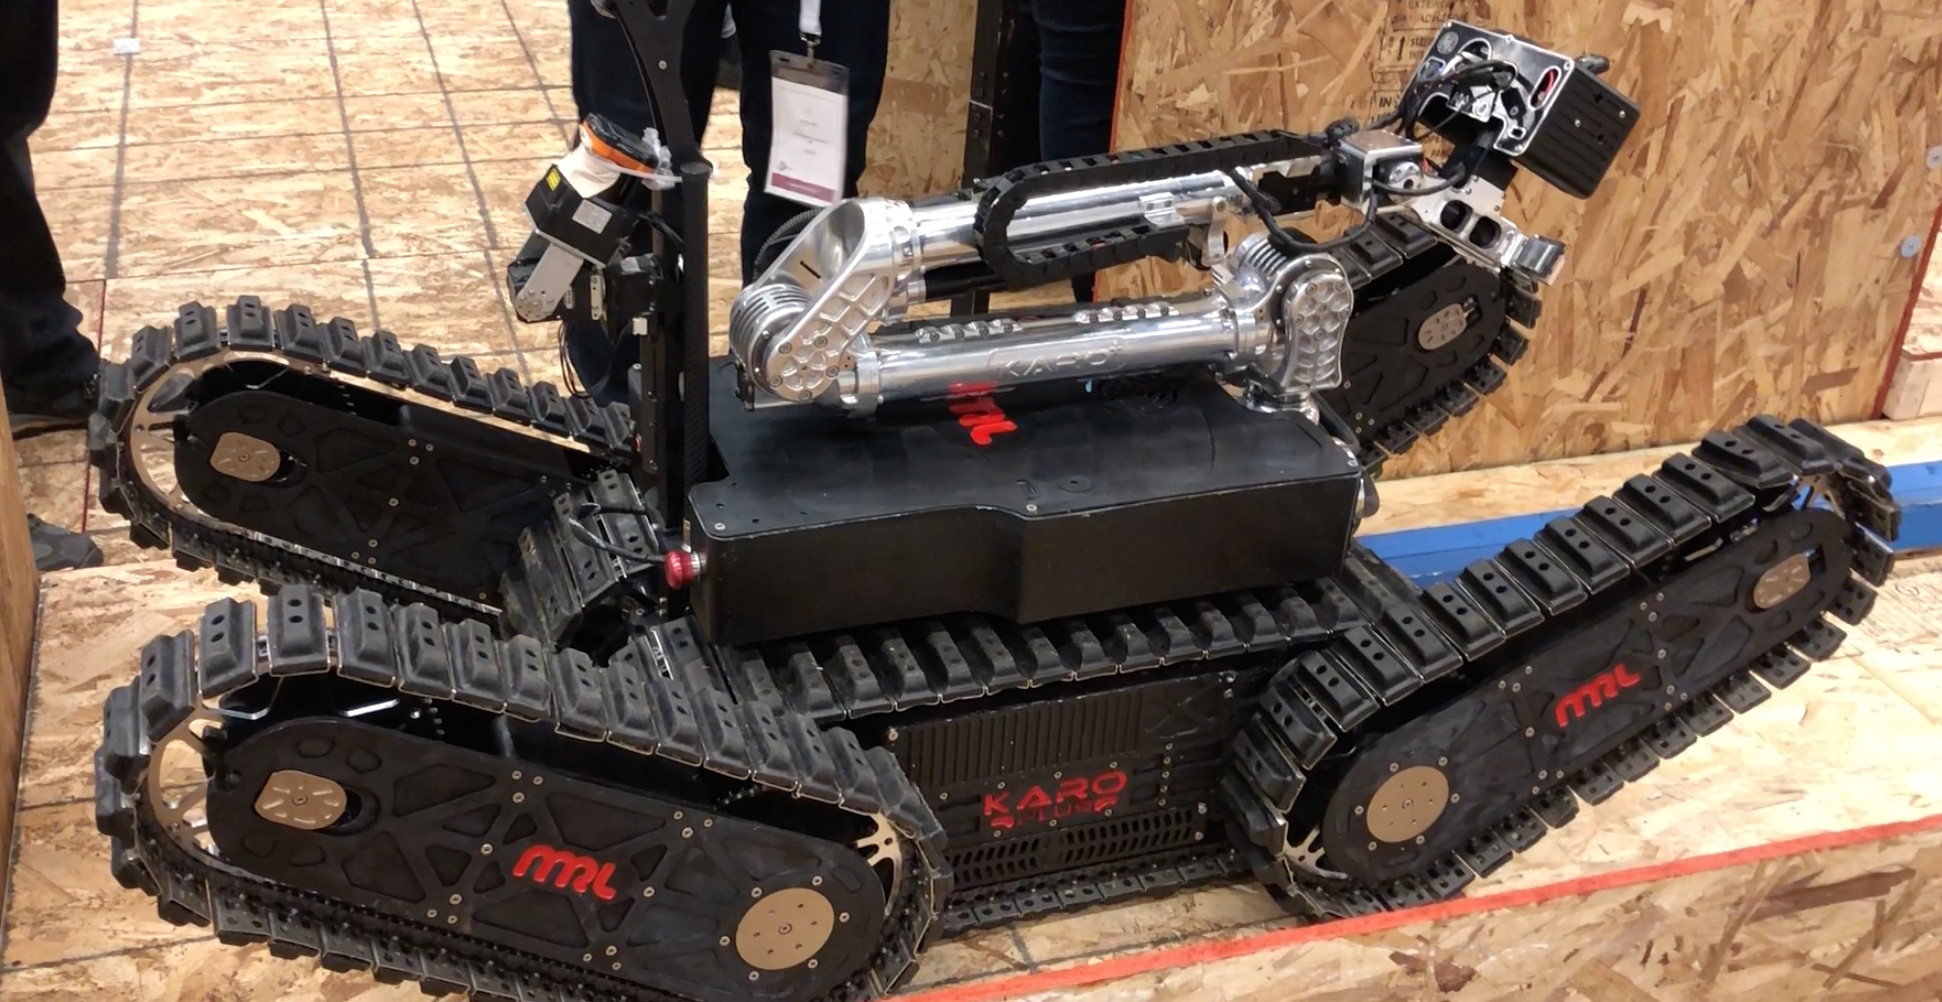
Rescue Robot League:
Navigating difficult terrain robots: These are primarily demonstrations of how 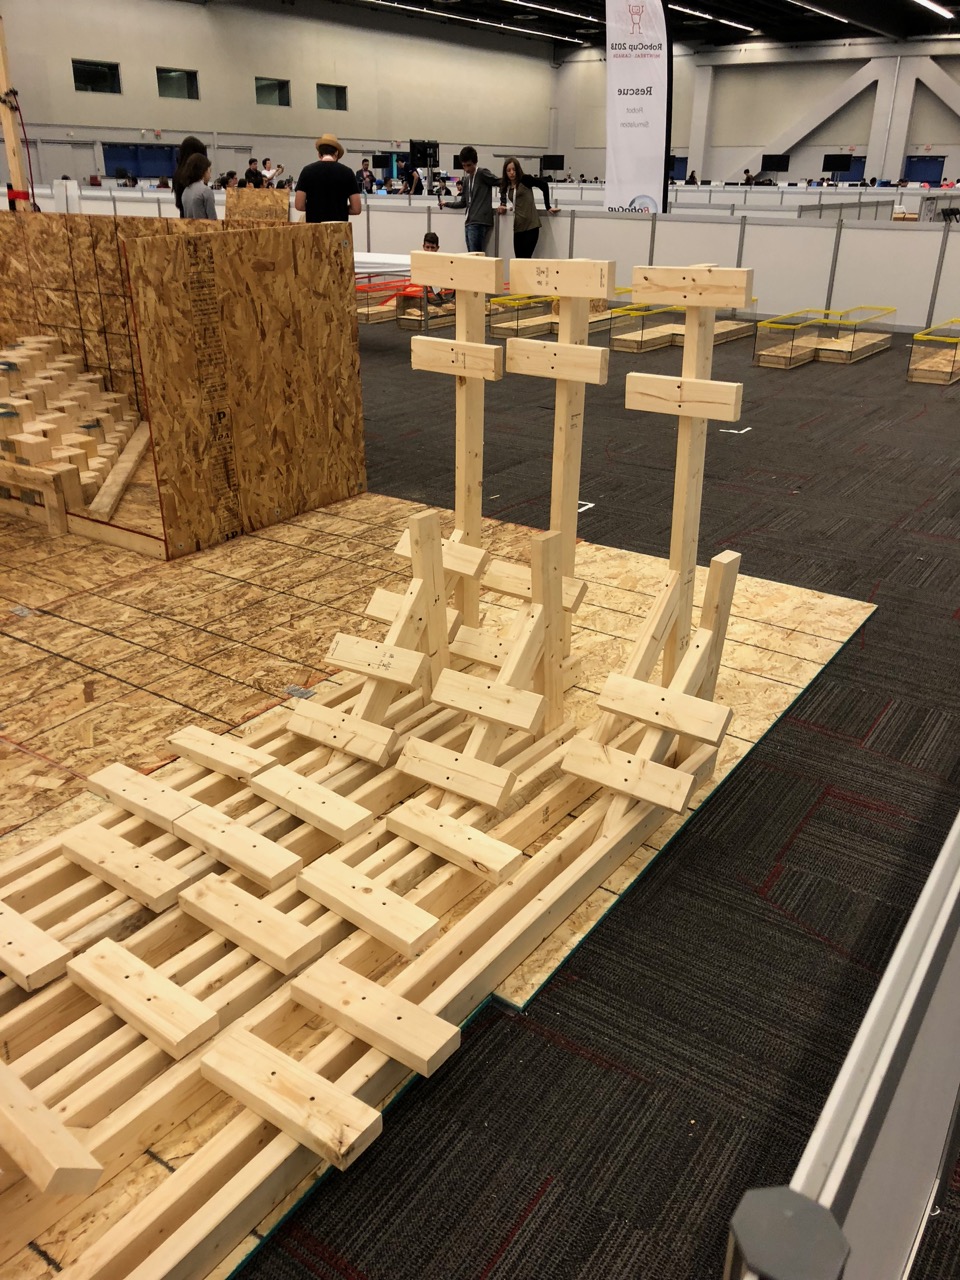 bots can be used in a hazardous situation for rescue. Challenges included navigating difficult terrains, opening doors, accomplishing tasks such as sensor readings, mapping a maze or path through the field etc. Some videos listed here are very impressive. These teams were mainly university and research lab teams. Do check out the following links.

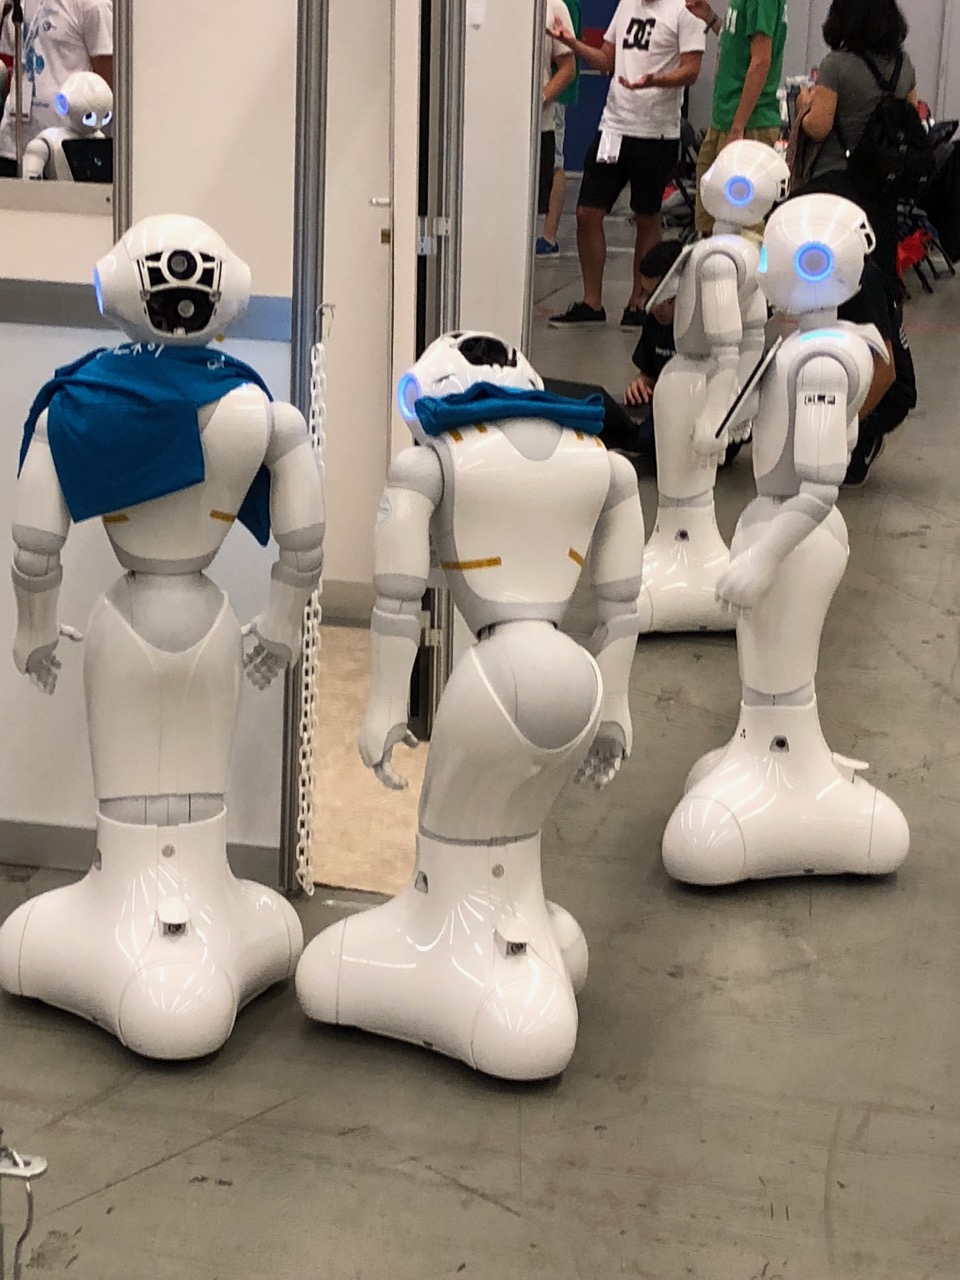
Sponsors:
Softbank was a big sponsor at the event.
 It has made huge investments into robotics. It will be evident from the following videos that making these investments is critical to succeeding in the near future when we expect a lot of the mundane work to be automated and mechanized.
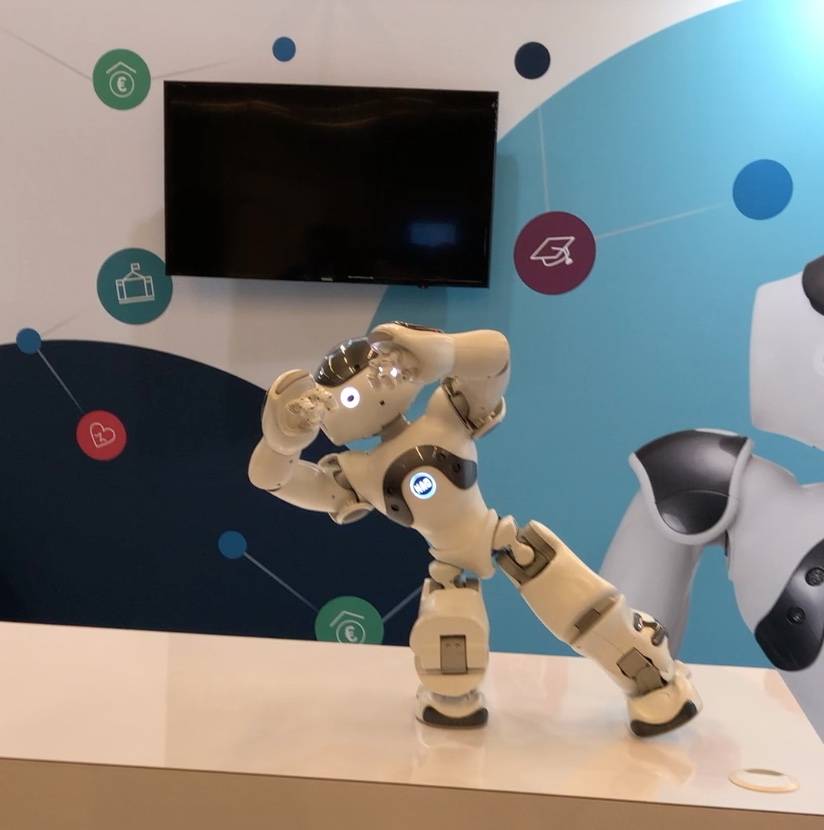
Closing thoughts:
We saw that we were competing against a number of national teams. There is 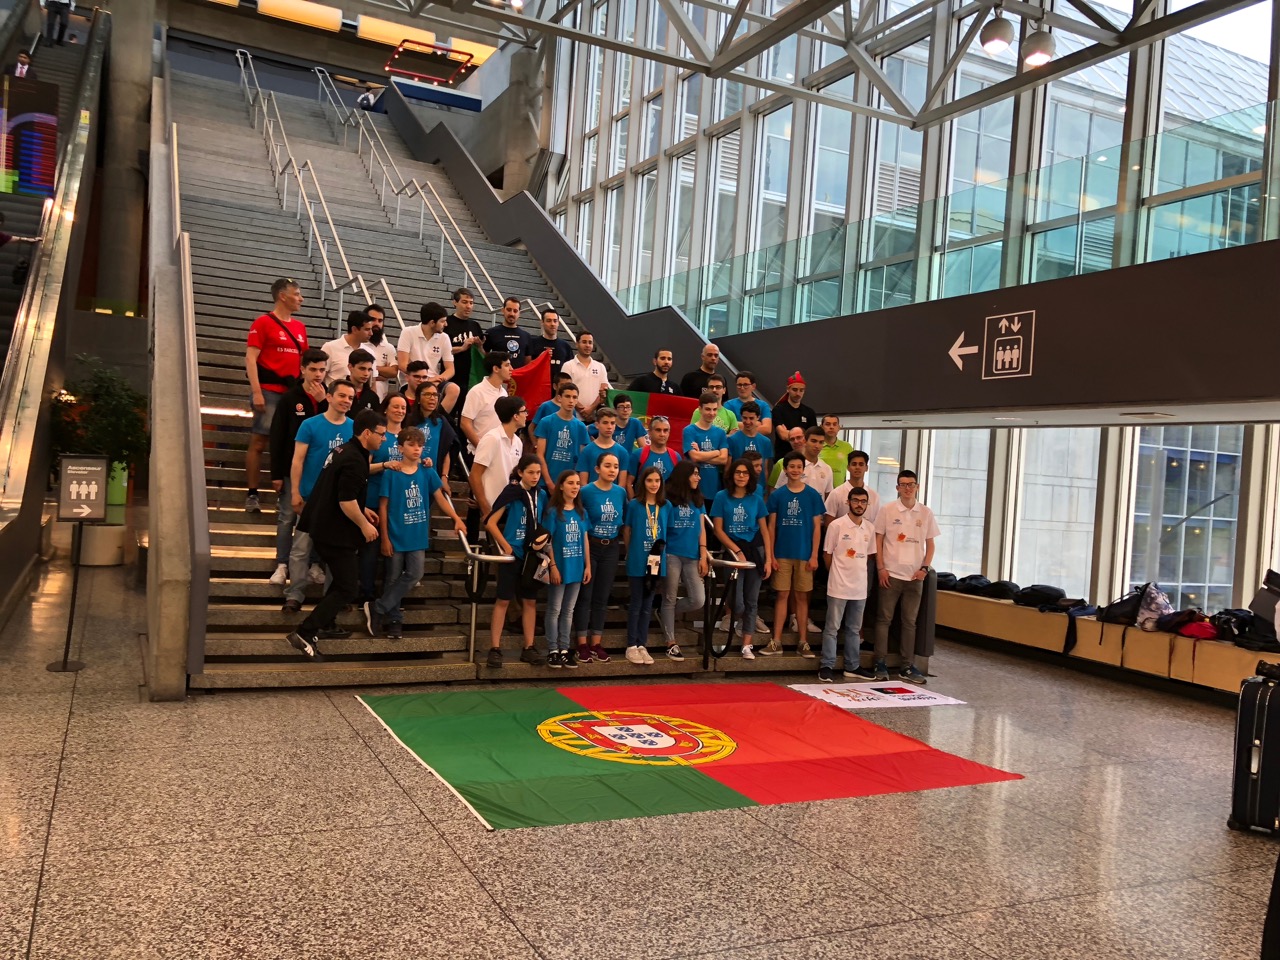 a huge difference in terms of resources and motivation from state sponsorship as was evident with the Iranian, Chinese, Russian, Singaporean, Croatian, Egyptian and Portuguese delegations.

A second learning was that at this level you need a stable platform and cannot afford to rebuild your bot for every run. Hopefully my son’s team is taking this feedback to heart and coming back to the competition stronger next year in Australia!
The kids had fun – here’s the team at the Notre-Dame Basilica of Montreal

 learn from experience E with respect to some class of tasks T and performance measure P, if its performance at tasks in T, as measured by P, improves with experience E.”
![\[\theta=(X^TX)^{-1}X^Ty\]](https://eli.thegreenplace.net/images/math/20baabd9d33dcd26003bc44c7d81ba39e1ad4caa.png) ) Refers to a set of simultaneous equations involving experimental unknowns and derived from a large number of observation equations using least squares adjustments.
) Refers to a set of simultaneous equations involving experimental unknowns and derived from a large number of observation equations using least squares adjustments. brains (biological neural networks). Such systems learn the model coefficients by observing real life data and once tuned can be used in output predictions for unseen data or observations outside the training set.