I came across an interesting economic growth model, while auditing Scott Page’s “Model Thinking” class at coursera. Even though the models he discussed are relevant to economic growth for countries and why certain countries grow vs. stagnate, I felt that this is very relevant to the investment decisions that technology leaders make every day.
Here’s a summary of the basic growth model Scott discusses – even though its a very simple model, it brings out the core concepts that you have to weigh when allocating your project investments between RTB (Run the Bank) and CTB (Change the bank).
The model is set up on an island that has workers and coconuts. You can create picking machines out of coconuts (investment) that helps increase your output. Machines are lost at the rate of depreciation. So formalizing –
Lt = Workers at time t
Mt= Machines at time t
Ot= Output in coconuts
Et = Coconuts consumed at time t
It = Number invested at time t
s = savings rate
d = depreciation rate
Assumption 1: Output is increasing and concave in labor and machines (capital)
Ot = √Lt * √Kt
Generalizing then –
Ot = Lt (1-β) * Ktβ
Assumption 2: Output is either consumed or invested
Ot = Et + It
Assumption 3: Machines can be built to increase output (using a concave function) but depreciate
Mt+1 = Mt + It – dMt
Assumption 4: Investment for the next period is output times the savings rate
It+1 = Ot * s
Since the output is a concave function, investment has diminishing returns on the output.
To achieve a long term equilibrium, investment would need to equal depreciation i.e.
Investment (Ot * s) = depreciation (Mt* d)
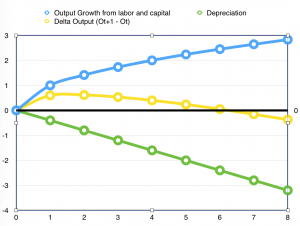
Since Depreciation is linear and the output in our model is a concave function, you would expect to see the following mapping for these effects:

So at a certain stage, because adding more machines is not going to produce enough output to sustain loss from depreciation, growth stagnates. The irony of this growth Model is that growth stalls or stops as the effect of depreciation becomes greater than the output produced through additional investment in new machines.
Next let’s consider the Solow’s growth model, that allows us to introduce innovation into the mix and addresses how to overcome this growth stagnation.
Ot = At * Lt (1-β) * Ktβ
where
Ot = output at time t
At = Innovation constant
Lt = Labor at time t
Kt =Capital invested at time t
Here the key investment choices that can be made by a senior stakeholder is how to divide up the investment between automation (driving up Kt) or game changing Innovation (At); and in my experience you are headed for stagnation or failure without carving out a portion of your budget to invest into innovation rather than just automation!
Here Kt would represent your RTB budget while a portion of CTB (elements dedicated to innovation) would essentially push the innovation constant higher. The key question you have to grapple with is the distribution between the two. And every organization has its own appetite towards making such division between these two types of funding. A few key factors driving such decisions are –
– Organization culture
– Level of competition within the industry
– Risk appetite for the senior executive team
– Whether you are a listed on a public exchange or privately held
Thoughts? Would love to hear your experience in budget allocations and the kinds of biases or preferences you have experienced. Please comment below or send me a direct email.

You have very good views and I agree with you